In my version of high speed Asphalt Rail, a complex of four cars in an articulated bus configuration will cruise up and down California at 140 MPH. It can do San Jose to LA in under three hours. They have their own asphalt speedway. Speedway buses cost a half million per car. Older asphalt can be refurbished and re-used. Within a few months we could be making trial runs between Fresno and Visalia.
The Very High Speed Bus Transit lanes would merge with the standard BRT lanes at major towns. Using diesel electric and all wheel drive shows nearly equivalent economies of scale to steel rail. Bus asphalt speedways cost minimum 2 million a mile to recover. So using old but under utilized roadways, costs drop.
In my area, the Fresno/Visalia metropolitan region, a speedway system could move a worker from Fresno to a Visalia job site in less than an hour, and save $75/day, payable to the worker. It would be built along the old 99 freeway, causing those businesses to update. We would use forward looking, stationary and mobile vision, add cross bars and warning lights, add digital lighting assist, and move on to certifying freight for the speedway.
Friday, July 31, 2009
A Post Modern Recovery?
Krugman, in this post, argues that a big G, and its deficits, might have saved the world from deep depressions. Then in this post argues:
"they’ve [post 80s recessions] proved hard to end (not officially, but in terms of employment), precisely because housing — which is the main thing that responds to monetary policy — has to rise above normal levels rather than recover from an interest-imposed slump."
So, my question is, Big G slows the downfall, but Big H slows the recovery. Is it not more likely that Big G going in and going out cause the same lack of response?
The recession is a slow restructuring because G slows down the restructuring process and also crowds out resources during the recovery. I would find it difficult to believe that bigness of G only affects the economy asymmetrically.
Is the stimulus working?
Kevin Drum would like to know. He quotes Josh Bivens the second quarter GDP growth:
"Federal government spending grew at an 11% rate in the quarter, adding roughly 0.8% to overall GDP."
Let make a multiplier formula. Total growth divided by government growth. The federal government consuming about 20 shares of the economy grew by 11%, annually; or grew by 2.2 shares of GDP. The overall GDP grew by .8 shares. Do I have to do the math for Kevin? If the overall economy grew .8 in the face of federal share growing by 2.2%, then we have a crowding out problem, the stimulus is actually shrinking the private sector. John Taylor is right, multipliers are very low.
One can see why Krugman never makes the multiplier argument that Brad DeLong makes, the multipliers are less than one, the economy is shrinking for every increment of federal government growth.
The problem is not the stimulus. The problem is that Obama is spending money specifically on programs not related to the cause of the recession, hence the low multipliers. Krugman is wrong, having a big G does not actually help at all, it makes thing worse as far as stimulus spending.
Tuesday, July 28, 2009
The Perfect Deliver Bot
I use Brad's term, Deliver Bot.
It is a four wheeled flat bed the size of a small car. With the help of an on-board robot arm it delivers standard boxes of goods to stationary mail boxes curbside. Deliver Bots cost abut $25000, but collect $100/day at $1/box of goods. The current auto delivery costs about $10/box, so we have returned $200 to the household for $20 in transportation costs per month.
Of the sales price, $15000 is hardware, the rest is software and digital devices, mainly vision systems.
The first community to adopt Deliver ots would see an sudden jump in retail activity, as well as the development of new retail formats.
Monday, July 27, 2009
Economists are cheating
Some anyway. They take their position as a license to moralize, then imply their moralizing is backed by economics.
Saturday, July 25, 2009
Helping Caplan with the future
He posts a blog on the effects of the Internet and the new consumption model.
Let me see. One of the things we notice about the future of goods is that it follows the flow of information. Rail tracks and telegraph wires. International telegraph at our ports led to overhead electric power for street cars. Radio broadcasting recast the suburban neighborhood traffic flow, radio reach defined goods flow. In each case, the information technology moves the lightest weight good, information; and through that path the heavier goods follow by widening the route.
The Internet will behave the same. Goods will eventually flow with Internet assisted automation, goods will become packets and automation pushes commercial goods delivery right to the home. The empty strip malls become UPS and FedEx re-distribution stations, nodes on a factory floor of automated delivery. The chack out stand, the post office box become mobile; moving right to the edge of the home with Internet assisted automation.
Monday, July 20, 2009
My solution to the Healthcare crisis
Medical Bulbouts. A bulbout branches off the main route of a BRT (Bus Rapid Transit)on the street. Each medical clinic is a three car, specialty clinic, complete with healthcare professional. Clinics set up in medical bulbout to gain huge transportation efficiencies by minimizing the movements of their patients. Got this idea from DeLong, somewhere.
This savings in medical transportation costs goes directly into the income pool for the health professional. So we can have pharmacy mobiles, appearing every to often to fill out prescriptions near the center of people.
More innovative uses of intelligent traffic management compounds the efficiency gains.
Another example is the bike car, a car on a three car RBT. Built to allow the biker to roll into the car with his bike. Special variations, each low in cost, each gaining advantage from increasing road intelligence. Special freight bulbouts, another.
Saturday, July 18, 2009
I recommend for manned space flight...
Focus on large telescopes constructed at the space station. Keep the shuttle form factor but greatly reduce weight and slow re-entry.
Regarding the shuttle; remove the requirement for polar orbit, reduce the requirement to return large cargoes, reduce net haulage. Then carry extra retro fuel reducing the return energy. Retro a much lighter shuttle to a much lower re-entry speed. The same solid rocket booster is OK for manned shuttle and automated cargo shuttle, separating risk and further reducing manned shuttle cargo weight.
At the station construct large mirrors, 20 metes in diameter, using the weightlessness of space and automation. Look to the noise limit of interstellar dust.
The Mystery of G.
G is the thing Kugman talks about in this post. His basic argument about G is that the bigger the G the bigger a deficit it can run during a restructuring. He claims the depression was big because G was small and could not absorb deficits. This is Money Illusion, not in the sense that Sumner used the term. If G is bigger today than yesterday is simply means that we have incorporated more functions in G than yesterday.
In other words, the bigger the monopoly, the bigger the stimulus effect. However the bigger the G the longer the time to adapt, I am not sure what we have gained by having a bigger G.
In other words, the bigger the monopoly, the bigger the stimulus effect. However the bigger the G the longer the time to adapt, I am not sure what we have gained by having a bigger G.
Simple steps for Traffic Planners
First, keep it simple. Then keep infrastructure costs minimum. Maximize participation.
The battle we fight is Silicon vs Oil on our asphalt roadways. Your most important weapon is the digitally assisted intersection. Your job is to open up the road to increasing levels of automation.
In real dollars, the base cost to digitize an intersection is $20,000 with a pay off period. If you enable both freight and passenger, then you payoff drops to six months, enough to get us out of the recession by early next year.
Use small trials. The cost is so low that a trial period for a few months is no worse than roadwork in its impact. So, get out the green paint buckets and invite in some BRT vehicles. Get some experimentals on the road. Have a parade.
Get involved in the freight side of the hubs and get the green lanes busy with freight in off-peak passenger periods. Get involved with the technology companies. Vision systems will rule this universe. Look to pay $500/camera for object processing cameras over the medium term. Enabled vehicles have object maps from both stationary and mobile visuals, so talk about communications among devices.
Low cost, extremely efficient, but you have to fight for the driving rights of the increasingly robotic.
Don't forget bikes and ultra-lights.
Thursday, July 16, 2009
Financial Systems and QM Theory
I model the financial system as a queue with direction flow. It suffered a bout of inflation, true, characterized by an attempt to add more term points than certainty would allow. All the sectors have a term structure, a yields curve representing inventory changes over directional flows. But inflation should always be a constraint and we would see distortions in the yield of the constrained sector. The financial yield curve is the one we always look at, and it is the fastest adapter, the money term structure. By the time we, the general observer, finds something new in the real economy as a whole, the money yield should have already adjusted.
If I go back to April 11, 2008 on my Universal Economic Calculator, I see a yield curve that looks in better shape than the one we have now. The stock market crash followed shortly. Except the short in is very fuzzy. I go to Frequently Used Charts and look at chart one showing oil vs ten year yield, the two curves had begun tracking, oil had slipped past a breaking point and had become the constraint.
The financial system was doing a good job and had begun tracking the constraint. This is what we like finance to do, adjust the yield curve to represent the average, but normalized yields of all sectors, weighted by economic share. Oil had simply become the constraint, so the yield curve more closely represents the flow of oil, over time, in a finite distributio network.
If the oil network was some how non-standard, then that brings up other issues, but the finance system performed OK.
So which sector missed the boat on the oil constraint? Local metropolitan government. They should have been looking for and pressing for newer, low infrastructure, systems for local transportation. Local districts should now be putting energy efficiency in transportation as their top priority, using computer intelligence to remove inefficiencies at every step of the way, on asphalt.
What are the binding constraints on the economy?
In order to present a simplified view of resource constraints we can compare the swing in nominal prices of various goods over the last few years. In particular, let's use the swing in house prices vs the swing in oil prices using the Frequently Used Charts page. The 11th and 12th charts display the Schiller index and the oil price nominal price over time. Notice the swing in house prices from the baseline of 100 in the Schiller index. The index doubles over the period in question. Look at the swing in oil prices, from a typical $40/barrel to $140/barrel, as swing of about 3.5. So, for the same change in aggregate GDP we see that oil swings almost 1.5 times as far as housing.
In this simplified view, oil is the constraint the bedeviled us, not housing.
In this simplified view, oil is the constraint the bedeviled us, not housing.
Wednesday, July 15, 2009
A BRT success story
From the Race Poverty Environment blog.
The BRT—A Success Story
"The popularity of Curitiba’s BRT has effected a modal shift from automobile travel to bus travel. Based on 1991 traveler survey results, it was estimated that the introduction of the BRT had caused a reduction of about 27 million auto trips per year, saving about 27 million liters of fuel annually. In particular, 28 percent of BRT riders previously traveled by car. Compared to eight other Brazilian cities of its size, Curitiba uses about 30 percent less fuel per capita, resulting in one of the lowest rates of ambient air pollution in the country. Today about 1,100 buses make 12,500 trips every day, serving more than 1.3 million passengers—50 times the number from 20 years ago. Eighty percent of travelers use the express or direct bus services. Best of all, Curitibanos spend only about 10 percent of their income on travel—much below the national average. "
Update:
I ran across this video of the Curitiba BRT from Street Films. Streetfilms also has a video on the Los Angeles BRT. The LA transit director calls it a "Rail Emulator", it is Light Rail without the rail. And also from Streetfilms, NYC's first BRT is getting good reviews. And finally, Streetfilms covers the Bogata version of BRT, which I consider the master BRT design.
Talking about multipliers, this report:
Summary Information
And this report about South American BRT plans:
"This summer, the bus rapid transit system of Bogotá, Colombia, earned the distinction of being the world’s first mass transport project to be approved (PDF) for participation in the Kyoto Protocol’s Clean Development Mechanism (CDM). As such, it is a model for similar transport-related CDM initiatives in the pipeline worldwide. Brazil, Chile, China, Ecuador, Laos, Panama, and Peru are all establishing or planning mass transport systems based on rapid buses, according to the Andean Development Corporation, the multilateral financial institution that helped develop the bid."
The BRT—A Success Story
"The popularity of Curitiba’s BRT has effected a modal shift from automobile travel to bus travel. Based on 1991 traveler survey results, it was estimated that the introduction of the BRT had caused a reduction of about 27 million auto trips per year, saving about 27 million liters of fuel annually. In particular, 28 percent of BRT riders previously traveled by car. Compared to eight other Brazilian cities of its size, Curitiba uses about 30 percent less fuel per capita, resulting in one of the lowest rates of ambient air pollution in the country. Today about 1,100 buses make 12,500 trips every day, serving more than 1.3 million passengers—50 times the number from 20 years ago. Eighty percent of travelers use the express or direct bus services. Best of all, Curitibanos spend only about 10 percent of their income on travel—much below the national average. "
Update:
I ran across this video of the Curitiba BRT from Street Films. Streetfilms also has a video on the Los Angeles BRT. The LA transit director calls it a "Rail Emulator", it is Light Rail without the rail. And also from Streetfilms, NYC's first BRT is getting good reviews. And finally, Streetfilms covers the Bogata version of BRT, which I consider the master BRT design.
Talking about multipliers, this report:
Summary Information
"A major objective of the Los Angeles Metro Rapid program is to provide high quality rail emulation service at a reasonable capital cost. The Los Angeles County Metropolitan Transportation Authority, in partnership with the City of Los Angeles Department of Transportation, conducted the Metro Rapid Demonstration Program—a BRT full-deployment feasibility project—along two major arterials: Wilshire-Whittier and Ventura. The Metro Rapid program along these arterials was implemented in June 2000.
A critical element of the Metro Rapid Program is the Transit Priority System (TSP). This system serves to improve on-time performance, provide real-time next bus arrival information to passengers waiting at bus shelters, and assist fleet management by recording travel time for each bus run. The traffic signals along the BRT routes were outfitted with the TSP technology to allow priority movement of BRT buses. At selected bus shelters along the roadside, highly visible dynamic message signs were installed to provide riders with the arrival time of the next bus.
The TSP system was deployed at approximately 211 intersections, covering 42.4 miles along both Metro Rapid lines. The total cost for the system was $4,243,000 which equates to approximately $20,000 per intersection, or $100,000 per mile."
It the intelligent signals reduce wait times at the typical intersection for 10,000 passengers a day by 2 minutes, that is 300 hours a day or $2,400 in savings at minimum wage. The intelligent signals pay for themselves in 8-10 months, a very high payoff.
"This summer, the bus rapid transit system of Bogotá, Colombia, earned the distinction of being the world’s first mass transport project to be approved (PDF) for participation in the Kyoto Protocol’s Clean Development Mechanism (CDM). As such, it is a model for similar transport-related CDM initiatives in the pipeline worldwide. Brazil, Chile, China, Ecuador, Laos, Panama, and Peru are all establishing or planning mass transport systems based on rapid buses, according to the Andean Development Corporation, the multilateral financial institution that helped develop the bid."
Tuesday, July 14, 2009
Experts evaluate California default possibility
Will California default? Or at least default more than it has so far? Some opinions.
From Home Front.
"The risk was the bonds being downgraded to junk and losing a significant percentage of their value. But with Governor Schwarzenegger and state legislative leaders now back at the negotiating table and hopeful to reach a resolution within the coming week, that downgrade is looking less and less likely. The budget impasse will be solved -- that's always been a "when" question, not an "if" one."
Forbes:
"Maybe so, judging by the CDS market. A recent quote put California’s five-year contract at $282,000 implying a 50% probability of default. By contrast, Thailand looks safer with a contract of $201,000."
What do I think? The default issue is a choice to be made by employees of California state government and their political leaders. If substantial cuts in state employment feels more painful than a constitutional crisis, then California employees will choose default. By staying on the job and allowing default, employees of government may feel they have a better chance in the judiciary than the legislature.
From Home Front.
But....some in the private market aren't so sure. CMA - a London firm that follows the market for credit-default swaps - puts California in some uncomfortable territory when it comes to probability of default. (Credit default swaps are a kind of insurance policy that banks, etc., can buy to protect themselves if a security goes splat).
On its Web site, CMA ranks the top 10 government entities in the world according to their probability of default. California came in ninth, with a 26.75 percent probability. It was just ahead of Romania (24.53 percent) and just behind Lithuania (29.38).
"In my view, there is a very HIGH probability that California will default.It’s obvious its debt merits a junk bond rating from every Wall Street rating agency.
And it’s equally obvious that the ratings agencies are artificially inflating the rating, stalling downgrades, and grossly understating the risk to investors."
"Quite obviously, then, the budget crisis in California is fundamental in nature; it's not a party-politics stand-off to score points with the voters. It won't be easily fixed in a (non-smoking, surely) back room where deals are cut and backs are slapped. This is REAL and is happening in real-time.
Default probability? Certainly a whole lot higher than the A/A-/A2 ratings would suggest."
"The risk was the bonds being downgraded to junk and losing a significant percentage of their value. But with Governor Schwarzenegger and state legislative leaders now back at the negotiating table and hopeful to reach a resolution within the coming week, that downgrade is looking less and less likely. The budget impasse will be solved -- that's always been a "when" question, not an "if" one."
Forbes:
"Maybe so, judging by the CDS market. A recent quote put California’s five-year contract at $282,000 implying a 50% probability of default. By contrast, Thailand looks safer with a contract of $201,000."
What do I think? The default issue is a choice to be made by employees of California state government and their political leaders. If substantial cuts in state employment feels more painful than a constitutional crisis, then California employees will choose default. By staying on the job and allowing default, employees of government may feel they have a better chance in the judiciary than the legislature.
Central Bank Screw Ups in 2003
Macro and other Market Musings has an interesting article about warnings given by William White and the research team at the Bank for International Settlements (BIS). When I read an article like this, I always rev up my Universal Economic Calculator. Doing so, I move the cursor back to the time in question, 2003. and sure enough, I see the yield curve bulging up and out, like a balloon held to the ground by low, short term interest rates. The ballooning is the effect of too many stages of production being established as a result of the steepening. It is not until third quarter 2004 that the Fed gets the hint that is should slowly raise short term rates.
Then I go to my Frequently Used Charts, and enlarge the inflation chart, third from the top. And there is is, in mid 2004 the inflation rate is exceeding 3%, above the Fed target. Also when I move the cursos to July 23, 2003, I see rapid changes in the yield curve as it tries to accommodate more term points. The history trace is much wider, showing overlap in the uncertainty bounds between term points. We would see this at points of transition.
So, behold, we discover that the Fed gets information about inflation too late, the Fed rather should simply focus in the yield curve; or change the parameters of their Taylor rule.
This was not the cause of the recession, however, but simply an illustration that central banking is late to the crime scene.
Christina Romer, multipliers and New Hampshire
Hot Air is reporting stimulus jobs coming in at $8.32 million per job, mostly bureaucrats, in New Hampshire.
Did we really expect anything better?
Did we really expect anything better?
Monday, July 13, 2009
Brad Templeton and BRT and freight
Brad Templeton is a RoboCar enthusiast as am I. We have been in e mail communications about the mix of RoboCars and BRT (Bus Rapid Transit).
Brad's essential argument, if I can interpret, is that RoboCars should develop independent of other traffic specialties, as the personal computer stood on its own. I could not respond on Brad's FAQ about the idea of special intelligent traffic lanes, so I respond here.
The movement toward BRT sometimes comes with a special lane and sometimes not. BRT does come with signaling help with stop lights at a minimum, but then Light Rail also has signaling help so this is not new and BRT is a replacement for light rail. BRT also requires more expansive boarding stations, as does light rail, mainly due to heavier passenger load per bus configuration. Articulated buses are common and often are the distinguishing mark between express buses and BRT. BRT is absolutely more efficient, with LA, Santa Clara, and other deployments consistently showing double the seat occupancy, and generally 30% to 50% shorter travel times.
My point is that freight haulers will want to be part of special BRT lanes, and freight delivery is likely to make a strong case that our economy depends as much on congestion free freight as it does congestion free transit. If freight haulers are willing to afford the special bulb out for freight loading or unloading, then they incur no extra congestion of expense to the BRT lanes. Intelligent high occupancy lanes gain efficiency as more vehicles use them with the associated signaling assist. The more traffic that uses the intelligent lanes, the more lanes that can be shifted from standard lanes.
So, we end up, because of the enormous gains in efficiency, with a great demand for personal autos, freight, and buses to obtain the associated intelligence to pack into the new mode of transport. That is the technology sector will be pushing the same intelligent technology across buses, freight wagons, and autos so that we get much lower cost in the digital systems. Signal light designers will be pursuing better standards and more efficient signal light controls. Freight warehouses in the city, pedestrian transit points, and other associate terminal technology will be shared across the all modes of transportation. Eventually automobile companies will make the case that specially equipped cars can operate in intelligent lanes without impacting BRT traffic. All this happens because of economies of scale in delivering intelligent traffic technology.
These lanes do not look all that special, often with little more than a curb or fence to separate them from "dumb" traffic lanes. Hence, they have relatively low infrastructure costs, often they appropriate a existing asphalt road and build out on that. The technology in these lanes will be developed by the same vendors that develop RoboCars, often mixing and matching the technology, especially low cost computer vision.
So, Brad's RoboCar is a bundle of technology from companies that likely will serve the same master, intelligent traffic flow. The level of human supervision monitoring this flow will vary, but basic intelligent lane technology will be a minimum requirement. If BRT continues its push, at the expense of light rail, then BRT will likely determine the standards for intelligent traffic management, including RoboCars.
BRT wins out over Light Rail in Montgomery County
Reporter Katherine Shaver reports for the WashingtonPost
"Montgomery County planners have recommended that a bus rapid transit system be built along the Interstate 270 corridor, saying that the other choice, a light rail line, would be too expensive to win federal funding.
The recommendation goes against the views of most Montgomery public officials and business groups. They have called for light rail as a more permanent investment in the rapidly growing and traffic-congested corridor between the Shady Grove Metro station and the Clarksburg area."
Sunday, July 12, 2009
Another Multplier Study, zero bound, multipliers
Mankiw links to this paper by Marty Eichenbaum, Larry Christiano, and Sergio Rebelo.
I will read the introduction in blog time. They talk about a mild shock to the discount factor and a larger shock to the discount factor. Let's talk about the difference between the two in Qm Teory. The mild shock reduces the integrated sum of the yield curve and stresses the current equilibrium points, but does not change them. The larger shock forced a dimansion reduction in the equilibrium set, a QM style deflation.
The larger shock requires time for the bankruptcy events as the economy re-constitutes itself to a smaller dimensionality or N-1. What happens to a fiscal stimulus under the two conditions, the stimulus. In the case of the large shock, the stimulus has an effect of paying off the bankruptcies, easing the deflation path.
In the case of the small shock, the effects are dependent on the ancillary constraints, and whether government plays a positive or negative role in the constraints. The stimulus may be negative, forcing stress onto a situation in which could have remained of the same dimensionality. If the ancillary constraint was something controlled by the government then in the second case the stimilus may be positive, depending on how it alleviates some offending constraint.
The authors talk about hitting the zero constraint on the yield curve. This is a condition that happens in central banking systems where the monetary market adapts slower than the offending shock. The condition should also happen at different times for competitive monetary systems. And due to the delay of transport problem with gold, zero bound will be ontained more often. When the monetary system is stuck at zero by an incomplete financial market, then the yield curve will demonetize pats of the economy until its natural shape is reached by deflation, or until the financial market clears a positive short term rate.
There claim is that large multiplier exist at zero bound situations. Well, yes, under conditions of forced deflation, then the role of the government sector, ralative to the private sector will increase. So, we are in the situation of government taken a much larger role of insurance i a much smaller economy, a bad result but a high multiplier. The result is bad because it takes us backwards in time, enforcing a technical regress.
The proper course, recommended by QM Theory
The goal today is for fiscal policy to remove its role in any sever economic constraint. One constraint the goverment imposes is size, when it occupies more of than its equilibrium share of the yield curve then we get measurement uncertainty, crowding out. If the economy expects to grow (inflate) but that the constraint of over large government prevents this, then the government needs to shrink.
An LA solution with Bus Rapit Transit and bicycles
This video is worth a watch. Keep in mind the concept of repurposing asphalt with rubber wheels and digital systems.
The National BRT Institute has additional facts. They talk about digital assists, transit centers, multi-modal traffic stations, signal intelligence and mixing robotics in High Volume Lanes (HOV).
The National BRT Institute has additional facts. They talk about digital assists, transit centers, multi-modal traffic stations, signal intelligence and mixing robotics in High Volume Lanes (HOV).
New Keynesian, stickiness and QM Theory
New Kenynesians have a name for some they cannot explain, they call it wage stickiness. In QM Theory we call it coherence.
In QM Theory, the economy is cognizant of the cost of restructuring and gains from economies of scale. We have a bias toward maintaining the current set of production equilibriums until the gains from restructuring exceed the bankruptcy cost of removing the old system. The firm has implicit accounting for the bankruptcy process as the economy nears a transitional phase.
Nominal wages insure a match between the production of consumer goods and the consumption. Aside from Brownian motion about the equilibrium, wages remain relatively stable. Technology shock generally causes the asymmetric bankruptcy and rebuilding process, but the point of transition is chosen, collectively, by aggregate management of inventory via the yield curve. Since a reorganization of the equilibrium points must occur collectively, the whole production networks must be redefined; it is to our economic advantage that all sectors synchronize reorganization. It is how we gain from asymmetry.
We operate in a finite dimensional production system because we have a biological bias toward economies of scale. By minimizing the number of production stages, we deliberately run the risk of bubbles in favor of the gains from reduced transaction counts. Hence we are deliberately asymmetric and deliberately create quantum mechanical inventory queues.
So we can answer the central question discussed in a Thoma post regarding Darwin and Smith. When does the relative incentive of the individual concflict with the group demand for minimal transaction counts? When the individul incentives leave the production queues with unsustainable shortages. At that point, our biologically inate ability to communicate collective certainy triggers a restructuring. The individual, upon entering the grocery store, observes a collective imbalance by observing inappropriate elasticities in the store shelves, a signal to the individual's sense of collective certainty, a force of coherence.
Safety standards in advanced cargo management
I consider the interaction of pedestrians and cargo at major commerce centers under the pursuit of automated cargo management. By Automated Cargo Management I include both pedestrians and material loading and unloading by automated processes. In this scenario, all traffic with microprocessor based automation techniques, regardless of the level of human supervision, all occupy high efficiency traffic lanes. High Efficiency Lanes may be occupied by Street Bots, Bus Rapid Transit, Personal Autos with Automated assist. Let these vehicles be called High Efficiency Vehicles (HEV).
The first consideration is pedestrian detection and interaction. We might recommend that automated pedestrian detection and interaction be required for the HEVs (Rapid But Transit, Street Bots), and stationary Automated Loaders. Vehicles using efficiency enhanced lanes would under go driving tests to evaluate their pedestrian management systems by insurance risk management companies. The anticipated cost of one unit of vision system should approach $100 to $200, adding as much as $500 cost to the typical high efficiency vehicle. Other ultra lightwieght personal vehicls that utse high efficiency lanes could apply very low cost visual signaling to the HEVs to simplify identification.
The second consideration in safety is a defined set of intersection signals, lane markings, curbing standards, lowering cross bars, audio cues and the rest needed for pedestrians with and without cargo to cooperate at loading pints with high efficiency vehicles (HEV). The HEV designs will have automated detection for these signals, including the voice based cab hailing. Government, Private partnerships could set these standards over time.
The third is HEV to HEV interaction, signaling between HEV units about intent. These may include both electronic and visual signaling. Visual signaling, based on current auto standards, would be coherent with current pedestrian expectations.
The safety standards are relatively low cost yet greatly reduce the risk of system shutdown due to pedestrian accidents. By aligning the safety standards with High Efficiency lane usage, then we gain economies of scale and predictability for the development of safety systems. Safety systems are lightweight and have very low infrastructure costs. And finally, safety standards give reassurance and risk assessement to government traffic bureaucracies, investors, and voters.
Saturday, July 11, 2009
OK, OK Unemployment, a quick solution
It is important to measure relative unemployment to identity the sectors with the most constrained inventory flow. Retraining is cheap, retraining uses the new technology. Find the constraint, find the monop0oly, change its actions so as to remove the constraint.
My View:
The constraint is transportation, the constraining forces are DMV bureaucracies.
It is the asphalt transportation network, managed by state regulators that must get involved and push automated transportation. State DMVs need to push for safety along with automation.
This Bubble that I propose, has as its main focus to reduce the number of transaction involved in moving a parcel across the nation to any location. That task will yield work for an entire generation, and result in huge pay offs in oil efficiency and lowered capital purchases. Retrain people to become transportation technicians, transportation engineers.
The Parcel Bot
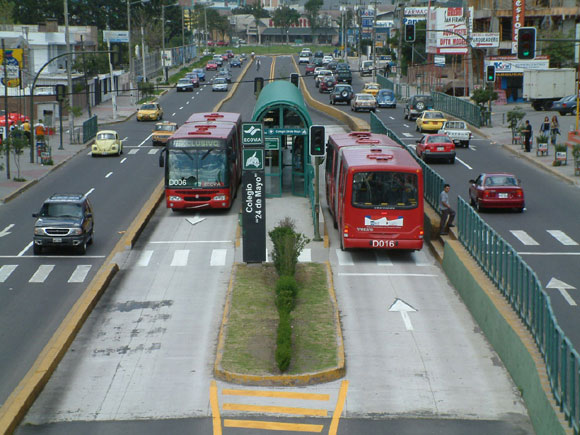
A pretty picture of Bus Rapid Transit in action.
Back to the thesis about parcel bots.
I distinguish between the parcel bot and the mobile checkout counter. The parcel bot is a mobile PO box store. The mobile check out bot has the mechanical arm.
We use the parcel bot to deliver any box to any address within one square mile, generally. I predict the parcel bot will lower the net current cost of local parcel delivery to $1.
Parcel Bot plays music, like the ice scream man. So the household runs out and shouts "Hey", they exchange with a cash card.
Shout out to Bus Rapid Transit (BRT(, Green Lane companions. Economies of technology soon gives us low cost Pedestrian Friendly Vision systems, standard on powered Green Lane vehicles, including BRT. This includes Personal Vehicles. Green Lane rules and Vision systems will be thoroughly tested, bicyclists welcome.
Friday, July 10, 2009
Creative Destruction, once again
Are Depressions Necessary?
Is the title of an article by Christover Hayes in the American Prospect, and it revisits the issues of Schumpeter's creative destruction. We have gone over this time and again, arguing from the standpoint of the natural asymmetry of economic change.
Krugman's criticism of creative destruction, as quoted in the article seems oddly out of place with his agglomeration thesis. Krugman, on the one hand, gets the Nobel for showing that increasingly dense interconnectivity among firms yields efficiency gains and agglomeration. The he is quoted in the article as hoping for the managed unwinding of these agglomerations when the economy encounters a new productive technology. How does Krugman intend for that to happen?
Mark Thoma implies that new productive processes need to be introduced over time, slowly. How does he intend that to happen? How would Thoma slowly introduce the personal computer into firms where they replace the mainframe when many firms had no mainframes to begin with. How does Thoma propose that we slowly introduce the automobile to replace the street car?
I fear that economists who lack theory resort to magic, the social director. One day, in my hometown in the late 20s, commercial radio appeared for the first time. The next day, economic decisions changed. Would Thoma have the social director monitor commercial broadcasts?
If we allow freedom of thought, then we will have productivity shocks. Short of running the economy like a North Korean work camp, there is no easy reversal of agglomerations. Krugman and Thoma should know that.
Yields are tracking Oil

I borrowed this chart from Ashraf.
My take away is that the economic yield now tracks oil supply after the crash. Hence, any action the economy takes to decouple from oil imports results in recovery, and any action which does not decouple from oil will continue the deflation. We are severely energy constrained.
Wednesday, July 8, 2009
Jared Bernstein seems confused to me
“There is no conceivable stimulus package on the face of this earth that would fully offset the deepest recession since the Great Depression,” Bernstein said in a telephone interview yesterday." Says Mr. Bernstein, the economic adviser to lil Joe.
What does he mean? That there is no knowledge within government that gets us to the next growth phase? After all, if government bureaucrats knew what was causing the Depression, their stimulus would be to simply tell us what they know.
There still seems to be confusion about why we had the oil bubble and the housing bubble. If that confusion rules the thinking of the economic advisers in government, then why do a stimulus at all? I do not remember that Keynesian, or New Keynesian, or Old or whatever works when government officials have no clue. However, if government officials had a clue, or at least some majority of them had a clue then they would say, "Stimulate X,Y, and Z; and the depression reverts to a normal growth economy"
What are government officials claiming? The best I can figure out is they are claiming that the lack of money for Medicare is the cause of the depression, or too much money spent in Iraq, or not enough money spent on oil efficiency. All of these are constraints within government, these are all government programs now that ACES has passed. If the current government policy is unable to fix what the current government believes is the problem, then we are in a depression from government failure, nothing more.
QM Theory tells us that we have a Treasury bubble becuse government is not meeting economies of scale for their major program(s). Hence, government goods have to be devalued or government has to get more efficient. Something is wrong with the manner in which the government sector is working. Hence, Bernstein is telling us that government is too incompetent to exist in a modern industrial society. If that is the case, then say that, Mr. Bernstein. Do not tell us that something is wrong with the private sector and cannot be fixed by government, because that is not true, government has the bubble. The economy expects Mr. Bernstein to fix what ails government, or at least state the failure of government.
Tuesday, July 7, 2009
Did we suffer the Paradox of Thrift disease?

Here is Paul's chart on the different savings.
I went back to the original BEA chart
Comparing line 10 and 2 I see that net federal government saving drops about 40% in the first quarter of 2008. In fact government new savings dropped continuously, both state and federal started dropping in Q3 of 2007.; while personal savings is still growing or holding steady.
It is more likely that consumers started saving after they saw that government spending was out of control. Rather than Paradox of Thrift, we would call it Alarm of Out of Control Government.
OK, Paul needs an update. This post of his showing causality is sometimes mixed. The Fed did not cause unemployment by lowering interest rates.
But, in the case of the paradox of Thrift, we have to assume that the Federal Governmet increased deficit spending in anticipation of the Paradox of Thrift. I still have a problem, since the paradox of Thrift claims recessions can be a result of too much savings, so Congress must have known we were about to get a Paradox of Thrift even though the Fed had just begun to cut interest rates. Is Paul saying that there was not yet a Paradox of Thrift in the first quarter of 2008, but Congress and the Fed began to prprepare for one? How did they know, either the recession had started and was not caused by Paradox of Thrift; or they expect a Paradox of Thrift in every recession. The causality argument falls apart. A better argument is that the Paradox of Thrift has nothing to do with causing recessions, but are a reaction to them.
The Yield Curve, its dimensionality and QM Theory
I take my Universal Economic Calculator and notice the Yield Curve is approximated by three straight lines. Running my pointer back to Dec 2004, I notice the Yield Curve is approximated by four or five line segments. Jun 2008 had six. QM Theory tells me that the stages of production queue were probably under determined today and over determined in Q4 2004 or maybe Jun 2008.
Warning about the Treasury Yield, it is an approximation.
Inflationary periods are those with multiple lines of production serving the same consumer function. It would show inefficiency in capital equipment utility, high transaction costs, more inventory volatility and higher prices. We are not in general inflation now.
When the economy recovers, it will emerge with an increment of one in its dimensionality; having chosen one of two possible equilibrium conditions for the critical resource. Hence, there will be a re-aggregation of the prior three layers of production, alog with the fourth. But shape analysis would say that the steepness will be reduced, we will see inventory activity in the 3 month to 5 year region. We would expect to see much higher efficiency than we ad in Jun 2008.
Monday, July 6, 2009
Solving the Oakland Airport traffic problem
The Oakland airport people moving problem and the San Jose people moving problem can be solved in similar fashion, without concrete guide ways. In the case of Oakland, the solution involves Green Lanes on the lanes of Hegenberger road. By simply using Green Paint and licensed Tram Bots, rapid, fast, efficient movement of people and freight from the Rail hubs, including Bart and the Airport becomes low cost. Like the Diamond Lanes in California, crossing the Green Lanes to make left turns would be legal, but otherwise human auto traffic could share the Green lanes under the same Diamond Lane rules.
The driving test for Street Bots would naturally include their ability to negotiate the few large intersections. However, like Light Rail, special traffic signals would aid their progress through complicated intersections. Human drivers would be no more confused than they are with standard light rail.
The appeal, of course, is our ability to replace concrete guide ways with microprocessor vision Street Bots and Green Paint. The barrier is, naturally, the desire of airport transit planners to "own" the road for their own purposes, hence vendors take advantage of the hubris of transit planners, forcing them to purchase expensive and unnecessary concrete structures.
Transit planners have to understand that Street Bots very soon will be more efficient drivers than humans. By providing them with a few cues and signals today removes the need to build large concrete structure which will only have a few years of use before being replaced anyway. Remember the California towns which built street vars tracks for only a few years in the 1920s after which all those rails were ripped out to make way for the automobile. We have the same transition point with Street Bots.
Street Bots can identify pedestrians
In this video demonstration. The vision system mounted atop an auto (human powered) rapidly and accurately identifies walking pedestrians on a busy street. The vision software was developed by ETH Zurich and Toyota. Notice the video also tracks the path of pedestrians. This technology is an essential breakthrough, not only to avoid dangers, but also to recognize pedestrians at a bus stop or pedestrians simply hailing a Taxi Bot.
An here is a UTube video of a robotic car driving down the road, from the perspective of the robot.
An here is a UTube video of a robotic car driving down the road, from the perspective of the robot.
Friday, July 3, 2009
Low Multipliers in Transportation
Says Ed Glaeser.
Where transit helps an ongoing agglomeration, as in New York, Boston; then that is a stimulus opportunity with transit funds. Allocating transit funds by political representative sometime gets it wrong. Better not to do it at all, and force local knowledge to solve local congestion.
Where transit helps an ongoing agglomeration, as in New York, Boston; then that is a stimulus opportunity with transit funds. Allocating transit funds by political representative sometime gets it wrong. Better not to do it at all, and force local knowledge to solve local congestion.
Thursday, July 2, 2009
Economist Magazine and the common fallacy of Street Bots
A comment on this recent article from the Economist magazine. It bares the common misperception about evaluating automated traffic on our roads. Here is the incorrect quote:
"Trains, meanwhile, are conceptually simple: they can only move forwards or backwards, and most of the time drivers need only watch for red signals and keep the train moving at the right speed."
What makes the trains simple to automate? Not the tracks, but the knowledge of human drivers not to drive onto the tracks when a train is coming by. Other than that fact, trains move through urban traffic, the criticism the article applies to computerized vehicles.
So the article ends up with this illogical conclusion that automated vehicles cannot drive in a straight line because they have no tracks. So, paint Green Tracks. Once the asphalt has Green Tracks painted, then the human drivers will treat the asphalt Robocars with the same care they automated light rail or automated rail freight.
Summary: There is no difference between automated light rail and tram bots running on asphalt. Anyplace a city puts a light rail tracks, the same solution works with Green Paint tracks, minus the expense.
Wednesday, July 1, 2009
A New Keynsian Multiplier Study
The will be lots of blogosphere comment about the study of spending multipliers by Cogan, Cwik, Taylor and Wieland. So, I will join in.
Before I comment, QM Theory is interested in the efficiency in which new government spending reaches useful products for the consumer. Absent any gains in efficiency, QM predicts the yield curve gets steeper and narrower. Mainly this is the effect of government goods piling up in inventory. The Fed, in response, would have to decide to either pull the plug with an interest rate hike; or continue the patterns of more quantitative easing to get interest to zero at 3 month and 1 year terms. The later course is hyper inflation as government contracts become increasingly expensive without limit.
An example of government goods piling up in inventory is the unsustainable medicare funding in which the unsustainability is represented by a backlog of medical transactions expected by the consumer at future dates.
Anyway, I think the New Keynsian model does incorporate yield curve effects, but it is still infinite dimensional so they include wage/price stickiness; the standard route to simulate a QM economy. In the QM model the expansion of government goods is followed by a yield curve adjustment to allocate the expense needed tfor final delivery of the goods. In over expansion the distrobution queue does not find a solution for final delivery and a reduction in equilibrium points occurs as the economy tries to down shift in the face of government expansion. Otherwise kown as the Treasury View.
I can give a summary now, but will return to this post. The summary is: Government needs to increase economies of scale before increasing spending.
Subscribe to:
Posts (Atom)