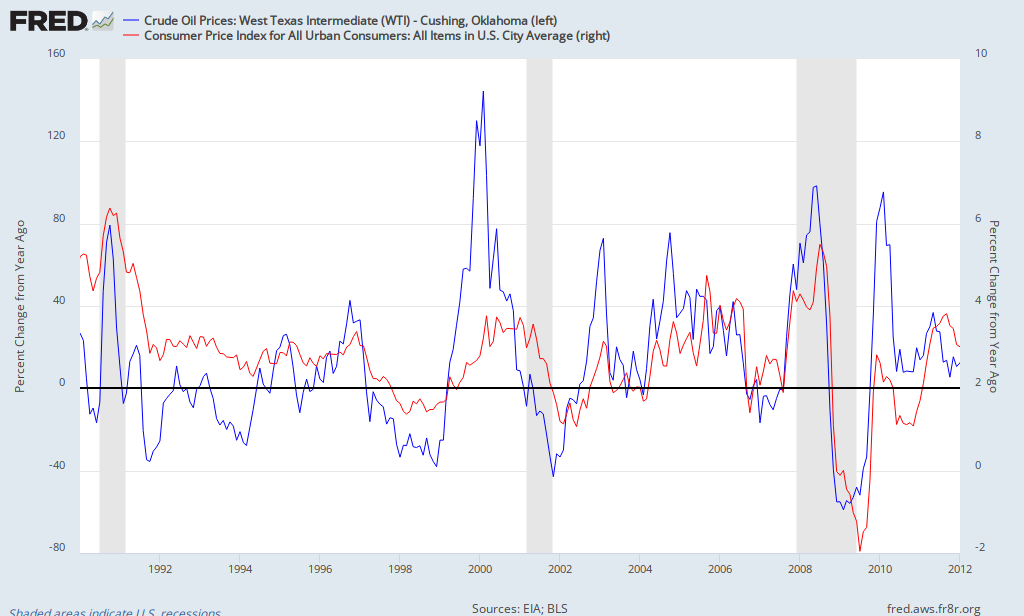
This is percent change in CPI-U and percent change in WTI oil. Look what happened since 2000, the two measures begin correlating. Prior to that, inflation was correlated with two or three constraints. How do I know? Because we only measure the three or four constraints. its too costly to start measuring the fifth constraint.
So, you got about 90% of the correlation is real between the unit of account and the flow of goods. Or, the variation in inventories among all goods in optimum flow, including money, will be related to the flow of three or four constraints. You divide that into two or three major constraints we deal with, you have at best 30-40% of the correlation between each of three major inputs and real goods flow.
This chart, since 2001, shows oil has been taking about 85-95% of the available variation, we are tuned to oil, oil is money; and that is a constraint on the economy. You cannot fake this. The problem was exacerbated by having one war too many.
Look what has happened in the last year, they diverge again, that is us adapting, that is why we had a recent soft landing. A watched pot never boils.
Here is the solution, solve this equation:
Seawater plus sunlight equals methanol. That is the shortest path out of the mess and it likely buys us 50 years, at least. Also, robotic transportation, that will buy you ten years.
Krugman:
Just a note: I keep seeing, both in comments here and in the broader discussion, assertions to the effect that government spending can’t create demand or jobs — basically, the claim that there must always be 100 percent crowding out.
Not a hundred percent, the chart show 85-90% crowding out.
No comments:
Post a Comment