Can you subtract the long-term trend, adjust for inflation and plot on a semi-log graph?
Bubbles are defined as extraordinary deviations, as such they should only be relevant if visible on log-graphs.
Of course the stock market has its trends (people systematically increase its value through regular 401k contributions) and one has to take into account the inflation, so only after adjusting for those you should be able to spot a bubble.
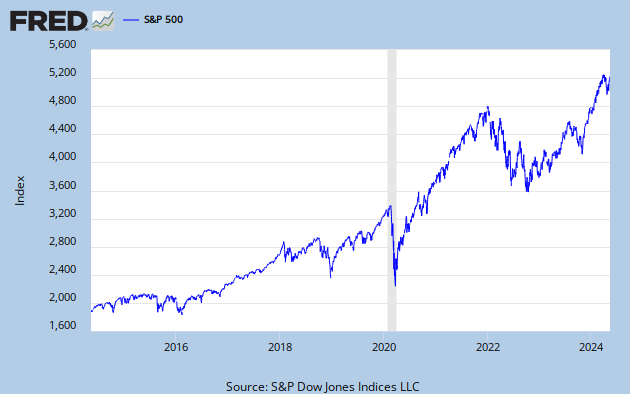
Personally, the current stock market high, especially when viewed in terms of lose Fed policy, does not look like a bubble. But I've been wrong before...
2 comments:
Can you plot on a semi-log graph?
Can you subtract the long-term trend, adjust for inflation and plot on a semi-log graph?
Bubbles are defined as extraordinary deviations, as such they should only be relevant if visible on log-graphs.
Of course the stock market has its trends (people systematically increase its value through regular 401k contributions) and one has to take into account the inflation, so only after adjusting for those you should be able to spot a bubble.
Personally, the current stock market high, especially when viewed in terms of lose Fed policy, does not look like a bubble. But I've been wrong before...
Post a Comment