| 2013 | 1.59% | 1.98% | 1.47% | 1.06% | 1.36% | 1.75% | 1.96% | 1.52% | 1.18% | 0.96% | NA | NA | NA |
| 2012 | 2.93% | 2.87% | 2.65% | 2.30% | 1.70% | 1.66% | 1.41% | 1.69% | 1.99% | 2.16% | 1.76% | 1.74% |
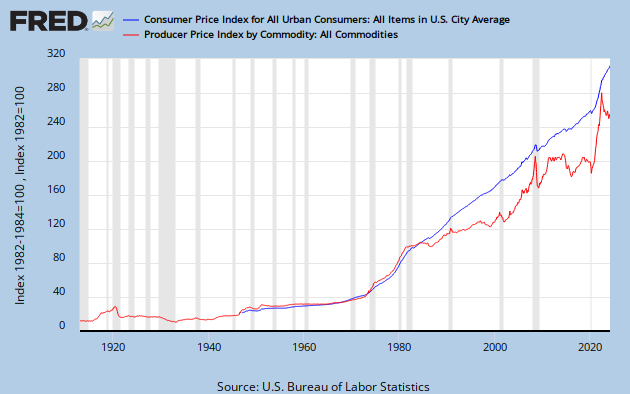 OK, now look at the consumer inflation (blue) relative to producer inflation (red). When blue is above red, then profits are possible.
The crash in 2008 was driven by a huge spike in producer prices, which forced many producers to leave the market, consequently the producer prices dropped. Not a demand problem, a supply problem. In spite of all the fanfare about demand driven recessions, I see none on this chart. I notice all the recessions were preceded by a spike in producer prices, the terms of trade change for the worse for producers.
This time around, producers are not under price pressure, the consumer is. What will happen? Dunno, actually, this seems like new ground. How long can consumers deal with constantly increasing prices when wages are decreasing? We will soon learn what a demand driven recession looks like.
No comments:
Post a Comment