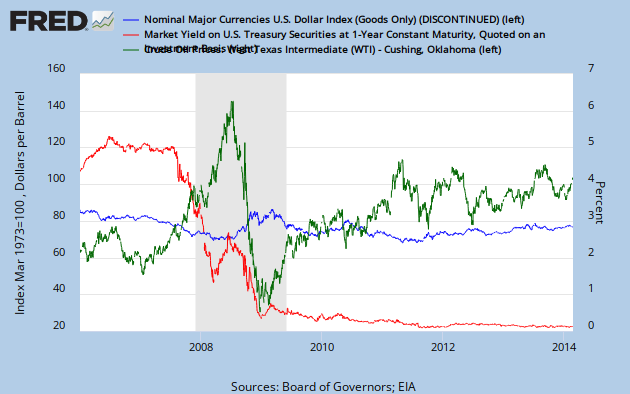
 This would be oil prices (green), Fed target rate (red) and dollar index (blue).
We see the Fed lowering the target rates in mid 2007. The return on one year reserves is too low, cash flows into deposit accounts because the return on cash is too low, and cash leaves the oil market. The economy demands more short term reserves, and will adjust cash on deposit higher if rates are too low.
But oil is still short. The market realizes this within a quarter, and raises one year rates causing oil prices to rise because the return on one year cash increase, the demand for short term cash slows and oil prices rise. Prices and rates then reflect the real shortage.
Here are the liquidity priorities: Rates barely more liquid than prices, prices a lot more liquid than oil. The more liquid thing adjusts sooner, the less liquid things adjust later. Sumner and Yglesias simply need to understand inertia and rate of change.
The trade weighted index shows that it is responding to oil shortages, not dollar rates. The dollar value rose as oil flows became stabilized. The over correction in oil prices in 2009 was likely caused by oil tankers being unable to turn on a dime. The net effect of Fed mal-adjustments was small, being easily corrected by the market within months.
No comments:
Post a Comment