Thursday, July 31, 2014

The effect of stimulus on California unemployment

Here is the stimulus, green line, and unemployment, California, blue line with national unemployment red line.  Anything at the peak of the stimulus? Not anything that can be noticed without some fraud on the part of the economist.  We can maybe detect one .1% slight bump, in the blue line, that that bump is well within noise. Unemployment setted in California at 12%, and hung in at the level way after the stimulus passed. California was just looking like a large state where unemployment grew fastest and reduced the slowest.

Economist who think they can prove otherwise should show their work.


I had to get up off the couch again.

What motion in unemployment rate are the economists claiming credit for?

Lets look at all the motions of unemployment since 1981.

Are the economists claiming credit because there was no sharp peak in 2009? In 81, we had the sharp peak, it was less in the 92 recession and even less in the 2001 recession.  Did they create a 'peakness' coefficient from those prior recessions? I do not see how.

Any model they had that could explain the level would be in error since their Phillips curve coefficient had been changing and was uncertain, and the only recession at these levels was 30 years past.

Any correlation they could have claimed at the top is not there, it is all symmetric noise.

No, their claims on the American Recovery Act are simply fraud, a desire to confirm their priors.

Stocks get hammered

Yahoo: Stocks got hammered on Thursday, with the Dow Jones Industrial Average ending the day down 1.87%, at 317 points in the red. The drop wiped out all but a tiny fraction of the major average’s gains for 2014, and put an end to a five-month winning streak for stocks.

But the Ten year yield is up! Cash is king again, investors getting ready for a rise in interest rates as the US Government will start raising the deficit to cover Obamacare costs already in the pipeline.

Wednesday, July 30, 2014

Regarding the accounting shift in Obamacare

Let's go through the number real quick.

The monthly Obmacare cash flow through the government is likely to be about 1/4 of the total  healthcare industry, 3.75% of GDP. But for normal add ons let us make that 1% of GDP per quarter. But the first two quarters will likely be 1.5% each because of start up costs.

The first state and local bill, 1.5% of GDP, was delayed one quarter.  But billing caught up, so we see a near 3% GDP state and local bill for Obamacare, one of those bills should be pushed back to Q1. That makes Q1 a -.5 print, and Q2 a 2.5 print.  Now, currently the Fed pays half, which would be another 1.5% over the two quarters, which will be remitted back to the states.  But the DC is just now getting billed. So, over the current quarter we should see the Fed dump nearly 1.5% of GDP in bonds and bills on the market to cover its half of Obamacare.  That is our test.

Caught by an accounting shift

The change in medical expenses in Q1 was not as negative as we think, the BEA likely forgot that there was a one time shift in payments.  This quarter the state spending covered last quarter's medical expenses which were undercounted. So I would expect DC spending to rise next quarter as the states bill the feds. In the steady state we are looking at about a 500 billion shift in GDP from consumption and investment (including private medical) to government medical (is a rough guess). That is about .05% of GDP, more or less. Whether the over all shift from private medical to government medical is profitable is still undetermined. We need to watch part time jobs again and see if wage slots are still adapting.


Also, note that Obama changed the oil export rules a bit, allowing a lighter grade of shale oil to be exported.

Why do we dislike Obama?

'Stop Hatin' All the Time' : Obama Slams GOP Lawsuit Vote“They have announced that they are going to sue me for taking executive actions to help people,” he said during an event in Kansas City. “They’re mad because I’m doing my job.”

Crimes:
1) He knew fully well that Nancy Pelosi was planning a near forced migration from Central America. She adverised her plot on national TV, and willingly acknowledged that her party engaged in racial pandering.  The plot was confirmed by the president of Honduras in the Senate, after the fact. You went along.  Crimes against humanity. Racial pandering.

2) You publicly questioned the wisdom of your own party in the migration plot, noting that Democrats would not gain, since California lacked a fair Senate vote.  So we have a president who willingly acknowledges his own party does not support fair voting. Crimes against American democracy.

3) Members of your on party are supporting the enslavement of the forced migrants for the purpose of covering deficits. Crime of slavery. 

My big miss

Gross domestic product expanded at a 4.0 percent annual rate as activity picked up broadly after shrinking at a revised 2.1 percent pace in the first quarter, the Commerce Department said on Wednesday.
That pushed GDP above the economy's potential growth trend, which analysts put somewhere between a 2 percent and 2.5 percent pace. Economists had forecast the economy growing at a 3.0 percent rate in the second quarter after a previously reported 2.9 percent contraction.
A separate report showing private employers added 218,000 jobs to their payrolls last month, a decline from June's hefty gain of 281,000, did little to change perceptions the economy was strengthening.

The consumer showed up, inventories restocked, and exports grew (probably oil  products). That was my miss.

The increase in gross domestic product in 2011 was lowered to 1.6% from 1.8% and it was trimmed to 2.3% from 2.8% for 2012 . . .  As a result of the changes, the economy expanded at a 2.0% rate from 2011 to 2013 instead of 2.2% as previously reported. Also look at state and local spending below, a 3 point surge.

Electricity Costs

According to BLS.

Manufacturing survey, previous history

Institute for supply management index:
A PMI® in excess of 43.2 percent, over a period of time, generally indicates an expansion of the overall economy. Therefore, the June PMI® indicates growth for the 61st consecutive month in the overall economy, and indicates expansion in the manufacturing sector for the 13th consecutive month. Holcomb stated, "The past relationship between the PMI® and the overall economy indicates that the average PMI® for January through June (54.0 percent) corresponds to a 3.6 percent increase in real gross domestic product (GDP) on an annualized basis. In addition, if the PMI® for June (55.3 percent) is annualized, it corresponds to a 4.0 percent increase in real GDP annually."
THE LAST 12 MONTHS
Month PMI® Month PMI®
Jun 2014  55.3 Dec 2013  56.5
May 2014  55.4 Nov 2013  57.0
Apr 2014  54.9 Oct 2013  56.6
Mar 2014  53.7 Sep 2013  56.0
Feb 2014  53.2 Aug 2013  56.3
Jan 2014  51.3 Jul 2013  54.9

The three quarters in the chart correspond to GDP of 4.1, 2.5, and -2.9.  The numbers reported above say an index of 54, we get a 3.6% GDP, typically.  This means, that absent any government or weather shocks or trade shocks, the manufacturing index correlates with consumer spending patterns and matches the aggregate GDP numbers. The actual GDP numbers corresponding to these three quarters were 4.1, 2.5, and -2.9; from July 2013 to Mar 2014.

So, we see both weather, Obamacare  and other shocks effecting the typical relationship between PMI and GDP.  After all, these are only manufacturing numbers, and they feed into consumer transactions which are 70% of the transactions. But we can see these PMI numbers count out changes of about 4 points over the year. Yet the changes in GDP count out -2.9 to 4.1. The difference, the final consumer deliveries, are all managed in inventory adjustments in the supply change.

So when analysts currently report a GDP outlook, they are reporting a very fickle variable called shocks to consumer behavior. The key variables are trade value of the dollar effecting imports and exports. And  changes in government taxes and transactions costs. These are all difficult to measure and have large geographical variation. The current key consumer variable is the Obamacare transaction costs and their effect on job distribution. Main changes are the wage setting adjustments and part time work adjustments; are they done? No they are not.  Retailers are very unsure, they do not see the feet in the stores. Part time workers change their spending habits.  Large states, like New York and California are seeing dramatic changes in the insurance industry, and these have large effects on job turnover.


Tuesday, July 29, 2014

Obamacare whoops

Bloomberg: Health-care insurance premiums for individuals in California rose between 22 percent and 88 percent in 2014 from last year, even after the federal health-care overhaul, the state’s insurance commissioner said.
California will see some of that impact in its Medical, so expect a Jerry Brown budget whoops soon.

Breaking up California polling

38% yes, 62% no. On line polling of the Six Californias proposal by Tim Draper.

We have a problem in 2020 after the census.  The SouthWest, Texas and California,  will be sending some 130 Carpet Bagging, basement dwellers back to the Swampland conjuring up a myriad of plot and conspiracies in the East Coast Congress.  DC will simply stop functioning and be in permanent sequester.

The California legislature.

To begin with this legislature has the collective IQ or a pack of rats, and mixing these poor fools with the 70 Carpet bagging delusionals, without Jerry Brown, means a permanent California flounder. Neither California not the East Coast can afford the outcome, it simply will not work.  Nullification will be commonplace as no state with an ounce of common sense will follow some bizarre plot from California representatives. The US is screwed.

Down to Reagan levels

The Federal budget as a percent of GDP.  Operating below the levels of the Great American Communist, Ronald Reagan. Thanks for the sequester. Note that Bubba Clinton had this ratio down to 19 percent. Maybe we should put Hillary in charge of the morass back east?

On what evidence is there a consensus

I have a hard time seeing any effect that could not be interpreted in either direction.  Did the red line have any effect on the blue line that made it different from the blue line during any other recession?

Obama: Tin Horn dictator of the world

He gives orders to Israel, starts trouble in the Ukraine,  and support rebellions in Middle East. He and that delusional pompous ass of a Secretary of State.

The presidential hand of wisdom

I think Bohner cringes whenever Obama puts up the paternalizing hand and the photos start snapping. When dealing with Obama, make you you are always at arms length.

20% market correction baked in?

Yahoo Finance is reporting a couple of analysis who say it has already started. Here is one:
Market Watch: The primary indicator that Cook uses is the “Cook Cumulative Tick,” a proprietary measure he created in 1986 that uses the NYSE Tick in conjunction with stock prices. His indicator alerted him to the 1987, 2000, and 2007 crashes. The indicator also helped to identify the beginning of a bull market in the first quarter of April 2009, when the CCT unexpectedly went up, turning Cook into a bull.

What is a Cumulative Tick?

I am sure he is measuring market entropy, or its complement, market redundancy. He wants to know if the combination of ways the market delivers information is balanced with the combination of trades.  When they are out of balance, the 'temperature' of the market will correct, up or down, to bring them into balance. This is Plank's curve type of analysis, measuring degrees of freedom in a Shannon optimized system. Looking at Fibonacci relationships does a bit of this, it looks for redundant estimates of value which can be eliminated, or decorrelated.  ZeroHedge does a lot of this, looking for redundant correlations.

How would I do entropy analysis?

Pick an index, say the SP500, and run a windowed Huffman encoder over the thing.  Vary the window size and the number of 'bits' until all the encoded trades are closes to each other in terms of -pLog(p), p being the probability of that trade out of the total trades in the window.  Then discount stock which make the resulting -pLog(p) curve out of balance from a standard Plank, reward stocks which make it look like a standard Plank. In other words, make the decoding tree look like a minimum NlogN spanning tree. When that happens, the market is delivering the maximum value with the minimum number of trades, that is minimal redundancy.

Nieto, Brown reaffirm SouthWest Federadtion independence

In a stunning blow to the Coward in Texas, Brown and Nieto reaffirm Federation independence from the United States of New York.
MEXICO CITY – Gov. Jerry Brown suggested Monday that Texas Gov. Rick Perry’s ordering of National Guard troops to the U.S.-Mexico border to address the surge in border crossings is misguided, urging politicians instead to heed the “religious call … to welcome the stranger” in addressing the crisis.

Read more here: http://www.sacbee.com/2014/07/28/6588043/jerry-brown-urges-religious-call.html#storylink=cpy

Rick Perry, socialist coward

Texas has seized its own border, been granted independence and now wants to rejoin the United States of New York. He is no founding father, simply a coward and socialist.
Texas Gov. Rick Perry compares the role of National Guard troops at his state’s border to the deterring effect that cop cars stationed along neighborhood roads have on crime.
Perry, in an exclusive interview with The Daily Signal, said even though the 1,000 military troops he activated to help manage the border crisis in his state will not be authorized to make arrests, the sheer presence of the military will deter illegal activity.
“It’s a powerful reminder that what you are doing is a crime,” said Perry, who has been a critic of the White House’s response to the border crisis. “It’s just like a law enforcement effort in your neighborhood, where you see a parked patrol police car on the corner, and the bad guys see it and don’t commit a crime.”

Maryland adopts slavery

Chris Van Hollen supprts the Maryland decision to enslave brown skinned Latinos.

CNews: Rep. Chris Van Hollen (D.-Md.)

 Congressional Budget Office that Van Hollen said indicated enactment of the Senate immigration bill (which gave illegal aliens a "path to citizenship') would "reduce the deficit and increase long-term economic growth."

The distribution of the constituents of vacuum

This chart I stole from Richard Bader, a chem professor at tin Ontario. He says:
Fig. 3-5. The radial distribution function Q1(r) for an H atom. The value of this function at some value of r when multiplied by Dr gives the number of electronic charges within the thin shell of space lying between spheres of radius r and r + Dr.
Now to me this is just the minimum redundancy distribution of the basic exchange spectrum between the constituents of the vacuum. If we consider 'light' as an exchange between two constituents of the vacuum which happens at some center frequency and has a spectra indicating variation in the exchange rate, then we have distributed that spectrum in the hydrogen atom, energy level one charge position.  The peak of this spectrum is where a bundle of Higgs mass more closely matches its Compton frequency.  At that peak, the greatest amount of the light spectrum is contained. To the left of that peak, the spectrum of light is high, the right sidelobe, byut the degrees of freedom are low, so there is not clear match between any bundle of Higgs mass that can stabilize the spectrum.  To the right of the peak, the spectrum of light contained is the low frequency part of its spectrum, which has greater degrees of freedom and greater bundles of Higgs mass can easily contain the spectrum.  Light spectra is essentially maximally contained within the orbital.

This spectrum should follow the -pLog(p) Shannon condition. Log(p) gives the number of degrees of light spectra, and p gives the frequency. In terms of sphere packing, the the most densely packed region of spheres is at the peak.  From the view point of a Poisson distribution, it looks like three to four spheres are queued up, and some sort of estimation like this should tell us what the relative number of spheres, and size relationships are that make up the vacuum.  If we know, for example, that the log function from the peak, out to the long end, is about 16, then we can take a shot at estimating distribution of motions available to spheres of 'light' at the surface of the sphere. The point to the left of the peak should be the Higgs bandwidth limit of the vacuum. There should be a minimizing phase shift between the two constituents that are light vacuum quants, the phase shift going from zero to the left, and increasing to the right; and at the peak the shift, minimum.

Monday, July 28, 2014

Is the Fed keeping rates down?

It just seems odd that short term treasury bills on the fed portfolio are strangely small, and have gotten miniscule since the crash. So how much is the Fed responsible for keeping short term rates down? I dunno, ask an expert. But there are reasons to believe the economy is crap and rates are low, even without the Fed's help.


Fisher seems to be the resident expert. He says:

"My sense is that ending our large-scale asset purchases this fall will not be enough. The FOMC should consider tapering the reinvestment of maturing securities and begin incrementally shrinking the Fed's balance sheet. Some might worry that paring the Fed's reinvestment in mortgage-backed securities might hurt the housing market. But I believe the demand for housing is sufficiently robust to continue improving despite a small rise in mortgage rates."

"Those of us who are the current trustees of the Fed's reputation—the FOMC—must be especially careful that nothing we do appears to be politically motivated."
He is essentially saying the Fed should get out of the DC bailout business. That means replace DC as I cannot imagine how a bunch of delusional swamplanders can do anything coherent. 


What does Krugman say:
Instead, we should wait until there’s really clear evidence of overheating in the form of sharply rising prices. The risks of moving too soon versus too late are not symmetric.

Wait for inflation? If we see a sharp rise in inflation, we can be sure that DC has started another recession.

Neo Fisherites

Fisher was another in a long line of mistaken economists who thinks disfinflation and rates are  correlated because of some expectation theory.  Plain simple math and flow of funds explains it, no need for the magic.  Here lets look over the entire 30 years since 1981:
There, I have even made it extra large, lets look. 1960, rates rise, inflation rises, until we get a recession. 1970, same, 1980, same.  Notice 1981, rates stayed high, inflation rose, until the recession, where rates and inflation diverged.  Note there is one exception to the rule, the Clinton period, in which DC began running a surplus, that is the one exception I find.  2003, rates and inflation mostly correlated, though inflation was slow to catch up, and rates slow to start rising. Then the crash. Since the crash we have mostly declining inflation and zero rates. The one exception was a dead cat double bounce. Overall, since 1980, rates have gone from 15% to zero and inflation has gone from 12% to 2%.

So we have two exceptions. 1) They diverge around recessions, and 2) they diverge when government runs a surplus. But otherwise, it is rates down inflation down. Take away those two exceptions, and most of the period has a likely 65 or better correlation between low rates and low inflation.

The theory is simple, the Fed is a monopoly and dominates the market.  When its earning are optimized, it is extracting funds from the economy. The earnings go to Congress, mostly, which should cause inflation having multipliers less than one.  And Congress does cause sudden inflation, just before each recession.

What about now?

I am not an expert on Fed flow of funds, but we had two months of a whopping 2% inflation, and are likely entering a long running bouncing recession. I do not think the Fed is working hard to keep rates down, they are naturally low (but I could be wrong) The current situation is rule 1 and 2, government spending large deficits combined with the Obamacare cost adjustment, the normal periodic recession induced by DC.

Nieto is OK

Bad Polls? Obama has a negative 54% rating, worst in post war history. But I still like Nieto, more than I like Obama, matter of fact. Glad to have him.
Plenty of world leaders would be thrilled to have the kind of executive hot streak blazed by Mexico’s Enrique Peña Nieto during his first 16 months in office.
In that short span, he and his administration have steered more than a dozen major new laws through congress, overhauling the country’s energy, banking and education sectors, among others.
Peña Nieto has stood up to powerful interests from Mexico’s business world and underworld. He has locked up drug lord Joaquin “El Chapo” Guzmán, the world’s most wanted trafficker, quieting doubters in the United States who questioned his crime-fighting mettle.
Yet for all the praise he has won in Washington and elsewhere in the world, Peña Nieto’s opening act is getting panned in the only place it really counts: Mexico.
After Time magazine put him on the cover of its international edition recently with the headline “Saving Mexico,” a flood of ridicule and derision followed.
Peña Nieto’s approval ratings have fallen fairly steadily since he took office in December 2012, dropping to 37 percent in one recent poll, with other surveys rating him in the mid-40s.
The biggest problem, analysts say, has been Mexico’s feeble growth. Last year, the country’s economy expanded at just 1.1 percent, far below the goal of 5 percent growth Peña Nieto set when he ran for president.
His most widely touted move, a constitutional amendment opening Mexico’s state-controlled energy sector to private and foreign investment, was advertised as a catalyst for faster growth. But it may take years for the benefits to materialize.

Let's predict the GDP report

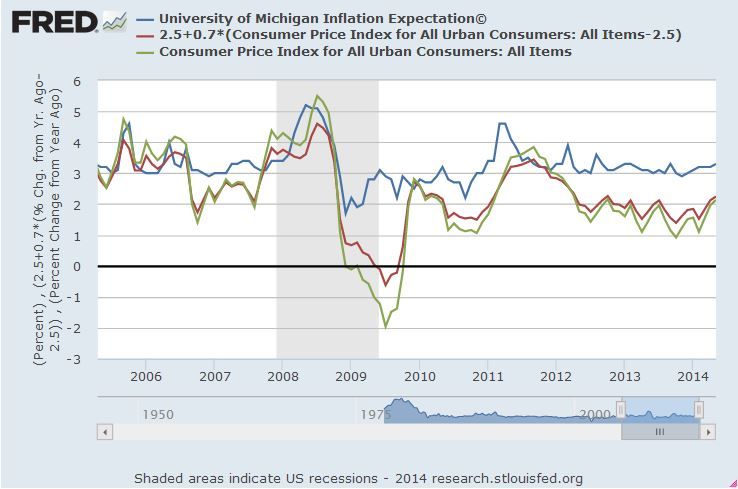
We can skip the consensus of 3% as BS from the business and retail economists, notorious liars. Let us extrapolate from this graph, the graph below and add in the Obamacare costs. The graph below is percent change from the previous quarter, so it includes the 3% reduction. Otherwise, 2013 shows a .5% increase, a 1% increase and a .5% decrease.

So, regarding the GDP chart, we have, in the series first differential , .5 1.0,.5,-3. From the chart above we can make out a similar series for YoY growth by grouping regions. Roughly we get:
 3.5,2.5, 1.9,1.2,-1; in 2013.

So, approximately, we can say the regions are 3 twos digits in a counter, which count from -3 to 1.0; the last count was -3, and they seldom change counts by more than 1.5, and a negative jump of 3.0 was an extreme, due to Obamacare. So, at the top end, we might say, the best we can get is a -3 jump to -.5.  Negative .5, my final answer; after the first revision. Given the need for a revision, I will say the initial print might be .5, positive.

Seriously, go back to 2010, when was the last time the regions made any combination that changed the delta by more than 1.5 points in delta GDP? Given three counters, that is about 12 combinations, and we have some 19 examples.  The maximum delta jump, in any direction being 1.5 (except for the Obamacare adjustment of -3). We are simply constrained to small changes of 1.5 relative to the previous number.. Obamacare has, if anything, made us more constrained and implies a negative bias. So a negative .5 is actually optimistic, and an initial print of .5 simply implies the usual counting errors of the BEA.

What was my method again?

I said the regions are the principal components that adjust the first differential of the economy, the change from quarter to quarter, that is what they count, quarter to quarter change.  These regions are constrained in the integral of the rate at which they count quarter to quarter change. Obamacare was the exception. The speed by which they count change is limited to about half the previous change, at best. The integral is 1/2 the first differential. Unless they over reacted to Obamacare, they are not likely to report a positive growth, quarter over quarter.

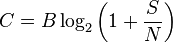
OK, Shannon again. The principal components are counters and whatever they are counting will have square noise, which I call the second differential.  The thing counted will have at least 1/2 as much power as the noise, mostly larger. Great, simple. maybe it works. Is this always the case?  No, consider President Brown and Neito in their trade meetings.  They keep signal large relative to square noise to avoid boo boo, they  undersample by 2 plus a buffer, that is square noise.  But they also keep an eye on what Texas President Perry is not doing, he is not having trade discussions. So, Brown and Neito are leaving space for a surprise Perry move, one way or the other, they are  assuming cubic noise; they triangulate. Rather than approach from the log base 2 to the natural log, they go from log base 2 to log base 3, they deliberately undersample so as to make room to maneuver whenever Rick Perry maneuvers.

Indiana is not doing all that well

Perhaps spending 20 years waiting for cookies from DC is not a viable strategy.

President Brown meets with Central American federation partners

LA Times: Gov. Jerry Brown, who begins his first full day of meetings here on Monday, wasted no time setting lofty goals for his trade mission to Mexico during a reception on Sunday night.
Speaking in a hotel banquet room to scores of delegates who are traveling with the governor, Brown said his trip "is not your ordinary trade mission."
"This is serious," he said. "There’s a lot we can do on some of the most important issues the world faces.”
Good for him, and on his way home he should meet with our other partner, Texas and President Perry.
And once again, let me extend a warm welcome to President Nieto, our newest member of the Great Southwest federation of independent nations. I just wish our fellow president had more than 38% of the popular vote.

Simon Wren-Lewis: Yes, governments are cyclic

In particular, if we have a demand gap of X that lasts for Y years, we can fill it by raising government spending by X for Y years, and pay for it by reducing government spending in later years. A practical example of what I call a pure government spending stimulus would be bringing forward public investment.
Anyone with an eight grade education can open up any Fed chart and see that, yes indeed, the aggregate governments of North America are cyclic. What is his friggin point? And why does he think there is mysterious magic in cyclic governments?  In North America, the Southwest government is cyclic, the Great Lakes government is cyclic, and the East Coast government is cyclic.

I mean, we have gone past this observation, some 100 millions different voters have looked at a Fed chart and discovered that governments are cyclic. What we need is a North American economist who can figure out the cycles. For example, why does the California government have a 8 year flounder and a 3 year growth period? Why is the long term cycle for the Great Lakes down? Why does Central America cycle along with North American governments?

If this is the best that Simon Wren-Lewis can do in terms of econometrics, then he should get out of the class room.

The Southwest is not responsible for the bozo

AP: WASHINGTON (AP) — The Obama administration pushed back Monday at a torrent of Israeli criticism aimed at Secretary of State John Kerry's latest bid to secure a cease-fire between Israel and Hamas, with U.S. officials saying Kerry had in no way abandoned key Israeli needs.

 I dunno why Israel is worried about the United States of the East Coast.  If Israel wants a different bozo running around causing trouble, I am sure SouthWest America can oblige. But I would suggest Israel skip the bozo thing altogether.

President Nieto, our co-president of SouthwestAmerica

Peña Nieto announced his presidential candidacy in September 2011,[8] four days after leaving office as governor. He formally registered in November 2011.[9] Peña Nieto garnered 38% of the votes and does not hold a legislative majority. His election marked the return of the PRI after a twelve-year hiatus.
Not too popular, but he is one of the three governing presidents of the new nation, along with President Brown and President Perry.  A bit of history:
Many Mexicans and urban dwellers worried that its return to power may signify a return to Mexico's past.[16] Peña Nieto promised that his government will be much more democratic, modern and open to criticism.[17] He also pledged to continue the fight against organized crime and drug trade and that there will be no pacts with criminals.

Well, good news that Mexicans hate the corruption as California is infiltrated with the stuff. So welcome Mexico and continue your fight against corruption.

Why is the deficit cycle regular but unsmooth?

The Keynesians want to know. We have the deficit in blue, not smooth, and unemployment, much smoother.

Why is the blue unsmooth?
For starters we only publish the deficit on a year by year basis. The cycle mostly appear in a presidential cycle, along with the recessions.  They have sharp peaks.

Smoothness is determined by how well the logarithm is known, the natural log is the smoothing operator. Government only has a two year and four year look ahead, it is not smooth.

Yet unemployment, relative to the deficit is much smoother, the plan ahead is much more detailed, so the smoothing process involves longer look back and longer look ahead.


Why do presidential cycles seem to line up with recessions?

Oil suppliers do not smooth savings, they suffer the Dutch disease:
In economics, the Dutch disease is the apparent relationship between the increase in the economic development of natural resources and a decline in the manufacturing sector (or agriculture).

So oil suppliers around the world save by keeping oil in the ground.  When the government runs deficits,  oil exporters do not invest in bonds as much as manufacturing exporters. So oil supplies are heavily influenced by the dollar value, and sudden tax changes in DC cause exchange rate changes and oil supply disruptions.

Saturday, July 26, 2014

Obama grants independence to California and Texas!

In a stunning turnabout regarding the ongoing secessionist plots, Obama has nullified all federal law east of the Rockies.  Celebrants in California and Texas immediately form the SouthWest Confederation to include Central America.  Mexico immediately assented and the first federation Congress is planned.

The Obama administration is preparing to effectively "nullify" the immigration laws of the United States through an executive action, says one Republican senator. As Time reported Thursday, President Obama appears prepared to provide millions of illegal immigrants living in the U.S. work authorization via executive orders:
When President Obama issues executive orders on immigration in coming weeks, pro-reform activists are expecting something dramatic: temporary relief from deportation and work authorization for perhaps several million undocumented immigrants. If the activists are right, the sweeping move would upend a contentious policy fight and carry broad political consequences.
The activists met privately with the President and his aides June 30 at the White House, and say in that meeting Obama suggested he will act before the November midterm elections. They hope his decision will offer relief to a significant percentage of the estimated 11.7 million undocumented immigrants in the U.S. “He seems resolute that he’s going to go big and go soon,” says Frank Sharry, executive director of the pro-reform group America’s Voice.
But Alabama senator Jeff Sessions, a Republican, says in a statement that the "temporary relief from deportation" would be a de facto ending of immigration enforcement:

Friday, July 25, 2014

Packing spheres of multiple sizes

Its a hot topic, and the three sphere problem is still being worked.  I was thinking about it regarding the spectra of two spheres exchanging position, a relatively important topic. Too much for my tiny brain.

Let call the volume of a large sphere r^3 and the area r^2. Then log base r gives us the information content of the volume and area as 3 and 2, the volume always carrying 1.5 times the information as the area. The Shannon condition requires P(x)Log(px) be less than one for each.


We also know that Phi = 1/2+sqrt(5)/2 will measure the bit ratio from the Phi^75, with 9e-3 accuracy to Phi^107 at the same accuracy, with a symmetrical peak at Phi^91, having a 9e-5 accuracy.

So,  the 1+S/R in this equation is optimally equal to P/Q, a rational fraction equal to Phi^91, and delivering Gaussian error, for the packed proton, with about 32 digits of accuracy. Set the one digit to the proton sphere. So, the highest 16 bits likely measures area best at the shell, and the lowest bit measures volume best in the center. The proton peak is where area and volume are equally measured. The shell is likely where p(x)log(p(x) for area is close to one, and visa versa for the center.

Is all this enough info to discover how many vacuum bubbles and their radius? I would think so. The variations in pLog(p) , from the proton shell out, or in, tell us how the combinatorics change. We should see two or three or four patterns changes as we move in and out of the sphere.


Obamacare whoops

This story violates my fundamental theory that we avoid redundancies.  Why would one Obama agency commit fraud then call in another Obama agency to discover the fraud?
The Washington Post reports that:
In undercover tests of the new federal health insurance marketplace, government investigators have been able to procure health plans and federal subsidies for fake applicants with fictitious documents, according to findings that will be disclosed to lawmakers Wednesday.

The results of the inquiry by the Government Accountability Office are evidence of still-imperfect work by specialists intended to assist new insurance customers as well as government contractors hired to verify that coverage and subsidies are legitimate. The GAO also pointed to flaws that linger in the marketplace’s Web site, HealthCare.gov.

According to testimony to be delivered before a House Ways and Means subcommittee, undercover GAO investigators tried to obtain health plans for a dozen fictitious applicants online or by phone, using invalid or missing Social Security numbers or inaccurate citizenship information.

All but one of the fake applicants ended up getting subsidized coverage — and have kept it. In one instance, an application was denied but then approved on a second try. In six other attempts to sign up fake applicants via in-person assisters, just one assister accurately told an investigator that the applicant’s income was too high for a subsidy.

The GAO’s account of fictitious applicants obtaining subsidized coverage goes beyond a related problem that surfaced this spring and that the investigators also cited: The government may be paying incorrect insurance subsidies to a significant share of the 5.4 million Americans who signed up for health plans for this year through the federal marketplace.

The GAO testimony contains updates on that problem, saying that, as of mid-July, about 2.6 million “inconsistencies” existed among applicants who had chosen a health plan and that 650,000 of them had been resolved.

Goldman Sachs has taken to pure fantasy

In this interview we see that GS has decided to skip counting all together, and just make up some fantasy.
ALLISON NATHAN: Jan, as Goldman Sachs’ chief economist, you have said that the U.S. economy is now growing above trend for the first time since the global financial crisis, despite the fact that GDP early this year was actually negative.  How do you square this?
JAN HATZIUS: It is quite a big contrast between the GDP numbers and other measures of economic activity that we summarize in our current activity indicator, which are higher frequency numbers, such as the payroll numbers, jobless claims, manufacturing surveys and so forth. When we look at those, we see an acceleration in growth really since early 2013, and especially over the last few months, to a year-on-year rate of 2.7 percent at this point. Which is still not superfast, certainly by the standards of past economic recoveries, but it is the fastest pace since the crisis.  And it’s the first time really that we’ve been clearly in above-trend growth mode. We would put trend at somewhere between 2 and 2-and-a-half percent. We think the GDP numbers in this particular case are quite misleading.  They are quite noisy. They jump up and down a lot.  They get revised a lot.  So we really think that looking at broader measures of activity that are available from something like our current activity indicator is probably better.

So,WTF are we supposed to do with an activity index?

Which ones could we have dumped?

BNews:
Pelosi: “You could even speak about, if it’s your tradition, Moses,” she said. “What would we do if Moses had not been accepted by the pharaoh's family? We wouldn’t have the Ten Commandments for starters.”

We could have skipped the thing about 'graven images, and maybe worked on Saturdays, or we could have coveted the hell out of our neighbors.  I dunno, if the pharoah's would have just partially accepted Moses, maybe we get a better deal.

Why do consumers overestimate inflation?

The blue line is the consumer survey about inflation. The yellow and red are actual inflation.
Robert Waldmann at Angry Bear wants to know.

Answer: Money is illiquid and cannot catch growth. So regions with growth have higher economic activity and less money report, they report disinflation. Regions with negative growth have less economic activity with more money, they report  report inflation. Money is late to the game. So the equation is the rate of change in relative growth and the inefficiency of money. It growth is concentrated, and fast moving, more people in low growth regions will report inflation and fewer folks in high growth regions report disinflation.

 Look at the regional growth chart. Blue is high growth. The colors are not always like this, so the colors move in regional patterns.  But currently more growth in in the west, away from the financial center of the east. I would ex[cy more reports of inflation and fewer of disinflation.

This would average out anyway. so I am still not sure of the whole story here. BLS weighting by share of family budget likely has something to do with it. The Michigan survey was a questionaire about prices, not an actual measurement of things purchased.  Consumers in regions of slow growth will see and report higher prices but are unlikely to buy everything in the price list due to high prices.

Jaynes and the principle of maximum entropy

Edwin T. Jaynes
Central to the MaxEnt thesis is the principle of maximum entropy. It demands as given some partly specified model and some specified data related to the model. It selects a preferred probability distribution to represent the model.

Systems evolve to minimize motion and the result is always maximum entropy, or minimum redundancy. Is this true? 
This is the entropy, say a sequence of disturbances. The log of the probability tells us how many quants the disturbance holds, and the probability tells us the relative frequency of this disturbance. So the log is the number of additive steps needed to disperse the event, and the probability how often those steps are used. When the sum is maximized, the probability of collisions between events is minimized.

Collisions

The system, by virtue of the Higgs fiels, maintain S/N ratios as agglomerations of the Higgs field. When collisions happen, in physics, the resulting collision noise multiplies through the agglomerations and reduces the total quant number N. This restores maximum entropy and the side lobes of the collision spectrum are lost as quantization noise. The Higgs spectrum is malleable, though finite. The log function is continually  maintained.

So Jaynes is right once we understand that the fundamental quant, the constituents of the vacuum obey the principle of minimum redundancy in their actions.

More poetry from the Fed!

Bond Investors Await Signals From Federal Reserve

WSJ Live 4:21 mins
Bond investors are eagerly awaiting any potential moves by the Federal Reserve. BlackRock Fixed Income Chief Investment Strategist explains how higher interest rates could impact investors. BlackRock's Jeffrey Rosenberg joins MoneyBeat with Paul Vigna. Photo: Getty Images.
And all the bond investors get is a MoneyBeat video. Perhaps they should learn to read.

Durable goods gone sideways

Zero Hedge chart
Basically a change of around .5%, which is noise. This implies more Q2 forecast revisions down, likely from 1.7% (IMF) to 1.5%, not much to write home about.

Overall, the US GDP will see three quarters of growth of about 0%, we are bouncing along in recession territory.

Obama takes a whallop

Gallop:

54% disapprove, 39% approve. This must be the reason DCers are hating on Putin.

Thursday, July 24, 2014

To heck with Manny Fernandez and the NYT

MANNY FERNANDEZ, NYT: HOUSTON — When Gov. Rick Perry of Texas announced plans to deploy 1,000 National Guard troops to help with the border crisis, it came with a power unexpected by some. By deploying them himself rather than through Washington, he has the power to order the troops to make arrests and apprehensions, something Guard troops in past border deployments have been prohibited from doing.
Immigrant rights advocates and others, including former federal officials involved in previous National Guard mobilizations, said the troops would lack both training and federal oversight, creating a risk of civil rights violations and deadly encounters with immigrants.

Texas is a free and independent state, by virtue of Nancy declaring the border null and void.  New York and any boneheads there abouts have nothing to say about it, you are in a different nation now.

The Keynesian differential and government cycles

Nick Rowe gets into the issue of the rate of change inn government spending and the change in growth.

Look, the economy cycles, the grey bars,  mostly on the presidential election cycle since 1981.  It was not always that way, but since 1981 it has been. Nor is it a 100% slam dunk, more like a 80% slam dunk.   Why? Government spending goes up right after the regime change, almost always, so the economy just lines up its expansion phase to coincides with the regime change, and that is where the recessions end up.

How much does this cost?

Well take GDP, separate out its normal motion and compare it with the presidential motion, using variance. I would guess about a third of GDP is lost.

Can we fix this? Dunno.

What about England?

Smaller economy, an Island, buffered between Europe and America. Who knows? I would give them a break.

Honduras denies involvement in the Pelosi secessionist plot!


BNews: Honduran President Juan Orlando Hernandez criticized United States lawmakers for creating "ambiguity" over the border laws during the fight for immigration reform. "It is a matter that arises, we believe, from the lack of clarity … the ambiguity .. that has become the hallmark of the policies and the debates that are being carried on the question of immigration reform here in the United States," he said through a translator according to The Hill. "And that is a situation that the coyotes are very perversely taking very much an opportunity to exploit."
Hernandez appeared on Capitol Hill today with Otto Perez Molina, the president of Guatemala, and House Minority Leader Nancy Pelosi.

Claims that Honduras had no role in the Pelosi immigrant plot, and the Honduras remains independent of Pelosi's new nation, Pacific America.

That would be six years of statistical fraud by liberals

Ignorance and fraud, now uncovered. SS is four times more insolvent in the years since the crash. So, if you are just entering the work force, you are likely going to pay another 4% in SS taxes. Cause? Simple stupidity among economists. I have pointed out, many times, a periodic function like social security is stable only if its gets periodic and small updates every 15 years.  Straight out of sampling theory, and as true as the economists is stupid. Liberal economists who did not know that are idiots, liberal economists who knew that are frauds.

The other rule of periodic economics? 

The end of the presidential term, lame duck season, is when the frauds are uncovered and the recession begins.  True now as ever. Total growth for the past two years averages some -1%, and that is recession. We are in a mild recession as we speak.

Drop drawer so Cuomo can have a peek

Albany: New York State is launching a campaign to collect coordinated data on residents’ sexual orientation as part of a comprehensive effort to improve health and human services for lesbian, gay, bisexual and transgender New Yorkers, the state’s health department announced Wednesday.
It would be the first such statewide effort in the country, Dan O’Connell, director of the state Health Department’s AIDS Institute, said in an interview with Capital.

Schziphrenic Persian declares love for Jews

Ayatollah Ali Khamenei
"While waiting for an end to this cold-blooded murderous regime, mighty armed resistance is the only way to deal with it.... Israel's annihilation is the only real cure, but that doesn't mean destroying Jews in this region,"

Wednesday, July 23, 2014

Whoops on Obamacare

CNN Poll: Eighteen percent of Americans, or fewer than one in five, say they or someone in their family is better off because of the Affordable Care Act, according to a new poll by CNN. Nearly twice that number, 35 percent, say they or someone in their family is worse off. A larger group, 46 percent, say they are about the same after Obamacare as before.

Smart cards not helicopters

Beckworth wants to inject money into the consumer markets:
Second, the Fed and Treasury sign an agreement that should a liquidity trap emerge anyhow [say due to central bank incompetence] and knock NGDP off its targeted path, they would then quickly work together to implement a helicopter drop. The Fed would provide the funding and the Treasury Department would provide the logistical support to deliver the funds to households.
Well, any agreement between the Fed and Congress is worthless.  Second, if the Fed needs logistic support from the Treasury then the unit of account is already broken. The Fed is the monopoly fiat banker, if it has no access to the retail banker serving the consumer, then the Fed is already  useless. So we are dealing with a broken banking system, or we are dealing with a technology change in money, or we are dealing with a corrupt government in DC. Decide which one it is.

I take the positive assumption, money technology has changed.  The Fed needs to use its regulatory power to encourage the adoption of the universal smart card. An intelligent credit card that can handle any and all forms of digital currency. Does this disintermediate the retail banker? No, the Fed is just making monetary exchange more accurate and efficient.  The Fed really doesn't disintermediate until it offers rates on balances held on the cards, but it not need do that right away.

Noah Smith gets it wrong on stagflation

Noah Smith: The first was the stagflation of the 1970s.  Keynesian SEMs predicted that when the Federal Reserve lowered interest rates, it should have given the economy a boost; instead, all it did was create useless, harmful inflation.

On the chart, effective federal funds goes up, CPI (inflation) goes up.  And visa versa. The one exception is the recession of 1974.

The curious thing is that I always catch these errors, everytime, and point them out on the site where the error is made, then post the fraud on this site.  Yet some economists keep on telling fabrications, knowing they will be caught.

What is really happening here?

Well Milt Friedman mostly got it right, finally. But the cause is likely something simple, when the Fed raises rates, it loses income and is faced with laying off staff.  That is a speculation, but probably close to the truth. But the coefficients either are lagged, and the economists assumes cycles (John Taylor), or the economists are simply frauds. Brad Delong has finally figured out that economists do not have a valid pricing model. Solution? Hand the problem to the matematicians and get it right.

I had to get up off the couch.

Whenever I see this,I  think, how could an actual, supposedly educated economists get the sign backwards.  That is impossible! So I have to get up off the couch, look closely, double check all the up and downs, do I have the colors right, I even diagram the sentence the economists wrote. I do this twice! I wonder, how can sanity even prevail in economics school, how many  undergraduates are constantly having to check, "up is up; down is down;, and so on. How do they get through it?

Outright fabrication by the National Retailers Federation

NRF: WASHINGTON--(Business Wire)--The National Retail Federation today lowered its retail sales forecast for 2014 because of slow growth recorded during the first half of the year, but said sales are expected to grow significantly faster over the next five months. NRF forecasted in January that retail sales would grow 4.1 percent in 2014 over 2013, but today’s revision lowers the forecast to 3.6 percent.
This is called fabrication to keep their stock price high.  Customers in the store have fallen, there has been an outright decline in the number of sales. So, how do they get sales figures up? By closing unprofitable product lines and shrinking the number of stores.  They more than make up for the lost sales by forcing out their fellow competitors.  In other words, they will contract and the total value of retail stocks will drop and the remaining players will have higher profit margins.  Will the retail stock investor figure this out? Who knows, watch retail stock values.

Tuesday, July 22, 2014

Does Dave Kotok have the same definition of tightening?

Dave says tapering is now tightening. He is chairman of Cumberland asset management.
The process of tapering is a gradual one that has been discussed by Fed officials continuously, and it is clear that, in the absence of some extreme reaction, they are going to sustain this path. What does that mean? By autumn, we will see issuance of US government securities at a rate of somewhere close to $400 billion annualized, whereas Fed absorption will be at zero. The Fed will continue to replace its maturities, but that practice will not add duration or supply any stimulus. In July, August, September, and October, for the first time, the change in rate between what the Fed absorbs and what the Treasury issues will result in a shift. That shift is a tightening.

What is Dave going to do? He is holding cash in reserve so as to have liquidity available when the Fed exits the market.  But Uncle Milt just said that when capital managers have liquidity to use when the Fed exits the market, then that is loosening!

Is this nutty? No, just everyone is confused by definitions.
What happens when the Fed is done with taper? Money will flow and reveal the true cost of government, and that means a fight in Congress and every nutcase economist will pull out their 'I told you so" model. This process will likely start in election season, about now.

Milt Freidman talks about liquidity

Milt Friedman got a few things right. Here are quotes about the fallacy of rates, but the real subject is liquidity, why it flows and why it does not. When the Fed dominates the lending market with its monopoly power and low rates, it is disintermediating the banking system, reducing its ability to flow money. When it exits the market it leaves the short term lending business and allows private banks to reconstitute that network, that improves liquidity flow. Fiat bankers get mixed up, we dunno why and it may be because of their capital owners.
Here is Friedman on what he called the interest rate fallacy in 1997:
Low interest rates are generally a sign that money has been tight, as in Japan; high interest rates, that money has been easy.
.   .   .
After the U.S. experience during the Great Depression, and after inflation and rising interest rates in the 1970s and disinflation and falling interest rates in the 1980s, I thought the fallacy of identifying tight money with high interest rates and easy money with low interest rates was dead. Apparently, old fallacies never die.

Freidman on Japan:
Milton Friedman: Yes, indeed. As far as Japan is concerned, the situation is very clear. And it’s a good example. I’m glad you brought it up, because it shows how unreliable interest rates can be as an indicator of appropriate monetary policy. The Japanese bank has supposedly had, until very recently, a zero interest rate policy. Yet that zero interest rate policy was evidence of an extremely tight monetary policy. Essentially, you had deflation. The real interest rate was positive; it was not negative. What you needed in Japan was more liquidity.
During the 1970s, you had the bubble period. Monetary growth was very high. There was a so-called speculative bubble in the stock market. In 1989, the Bank of Japan stepped on the brakes very hard and brought money supply down to negative rates for a while. The stock market broke. The economy went into a recession, and it’s been in a state of quasirecession ever since. Monetary growth has been too low. Now, the Bank of Japan’s argument is, “Oh well, we’ve got the interest rate down to zero; what more can we do?” It’s very simple. They can buy long-term government securities, and they can keep buying them and providing high-powered money until the high powered money starts getting the economy in an expansion. What Japan needs is a more expansive domestic monetary policy.

Matt OBrien, at Wonkblog, needs a bit more math

Wonk Blog: Dear inflation truthers: This is how averages work
Well, not if you know as much math as a third-grader. See, the inflation rate is just the weighted average of all the price changes in the economy.
Sure, but the weights are non-linear.  I look at that below, however, let us ask the more basic question.  A 2% inflation over 70% of the prices in the 20 trillion dollar economy comes to, 280 billion in more cash than sales. Where does that extra money come from?

Let me help Matt out. In the steady state, we have either fewer sales or more money. It is one or the other.  There is one source for the money, the Fed's digitizer.  The Fed is releasing some 75 billion per year in interest rate subsidies to Congress, that is free unencumbered money.  Any other borrowings by Congress is backed by market based interest payments.  So, we have some 200 billion in  extra prices to account for. Matt may think that extra money is a transient effect, soon to be returned after the downturn.  But that is a six year transient effect.  That is a long down turn.

The other cause of the inflation could be shortages, fewer producers and more demand. This chart, for example:
Fewer transactions for each dollar?


What about those weighted averages?
Well, Matt Obrien, you are going to need fourth grade math. Prices that drop have a shorter than linear shelf life, they get under counted. So, in the end, the 2% inflation needs some more work, more than we are getting from the wonkblog. The most likely cause of inflation is a continual supply shortage due to Congressional spending with multipliers less than one.

Inflation, 2.07% yearly

Rates, annual, for all consumer items this year:

1.58%1.13%1.51%1.95%2.13%2.07%

The BEA says most of the inflation was energy and food (4/5 of it).  Half of the food inflation was likely the California drought. Is this bad or good? I think the price distortions were within reason, they were adiabatic, not likely to cause structural disruptions.

Will this inflation generate tax revenues in DC? The question here is; can Congress sneak by without a budget confrontation thru the mid term elections? Maybe. If we get a real GDP growth of 2.5% then Congress can fudge the budget issues. But the coefficient on tax income is not linear. It drops dramatically with low growth because the high income tax bracket is based on merchant income. If Congress dips into the market too swiftly, rates and prices rise. The Fed gets bounded.

Pelosi is the very definition of political pandering on immigration

BNews: In Washington, I see an embrace of the idea that this is a humanitarian crisis by people who are not politicizing the issue.
Nancy Pelosi is exactly the person who went on TV months ago and announced the she was pandering the immigrants to get votes.  She and Obama discussed the political pandering idea publicly.  

Not a very good recommendation

Krugman:
Talk with Barack Obama, and you’ll find that he has a basically Keynesian view of the world. It may have wobbled a bit in the past, at times when he seemed to buy into the Confidence Fairy, but it’s still his basic outlook — and his aides are very much IS-LM macro types. True, they haven’t gone all out to push for fiscal expansion in the face of opposition (but remember the payroll tax cut), but that’s mainly a political judgement on their part. It’s not a fundamental difference in worldview from friendly economists.
Barak presided over the most dismal growth period in recent history and is the most unpopular president in the post war period. So, if that is Keynes, no thanks.

Monday, July 21, 2014

How triangulation works in California

Jerry Brown is the expert in the cubic root. He knows we got our cookies from DC, he got his tax bracket in the New Years 2013 tax deal, he got his Obamacare cookie. So, the issue for him and the California Democrats is now the water project, and Jerry has to wait until California has its turn in the tricycle. 

So, Jerry is not going about supporting the notion that California gets free cookies with this idea of infrastructure spending.  Only an idiot from Harvard still thinks in terms of symmetrical degrees of freedom from DC. The infrastructure cookies go somewhere else, and after a spell of three years, California can go get a water project cookie.

Its all about how often the cubic root comes around, California gets every third cubic root. Texas should get its turn with permission to export oil. The Great lakes rust belt never once got a cookie in the entire term of the current lame duck, they are second in line, after Texas.  New York got an extra ration of cookie with Obamacare since they fucked up the health insurance business the most, so New York has to skip a turn. This is the triangular rotation. All the good governors of large states know the system.

Good grief, now its the geeks!

SAN JOSE (CBS) — There’s a new app in Silicon Valley — conservatarianism.
It’s the app that conservative Senator Rand Paul is pushing. He wants to join forces with local techies.
But how can technology and liberty flourish side by side? Paul’s answer, “shrink government.”
The last thing we need is a bunch of Silicon Valley geeks trying to coin new politics.