
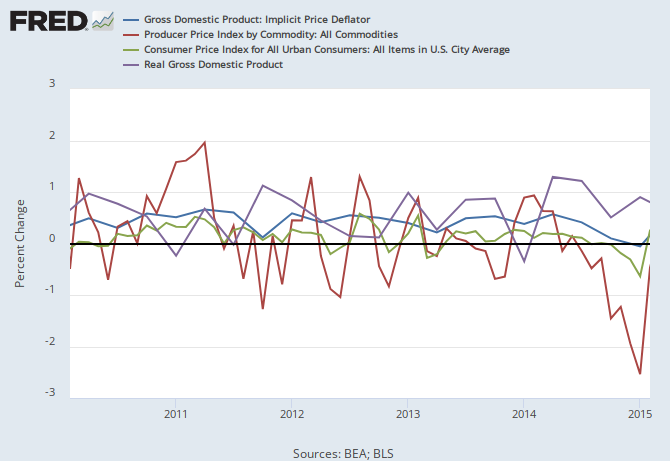
The Producer price index is showing a -1.7%, very recent, numbers, but that thing is volatile. And this number came from the commodities industry. PPI is the Red and it does spend time in negative territory. It makes up about 1/4 of the implicit deflator. The CPI, all itmes, green, above did dip into negative territory during the crash. Its current, most recent value is near zero, I think. The last release had it as -.2, according to Market Realist. These numbers are in flux as the NowCast GDP report expects a .6^ GDP growth rate, and that is a drop from 2.2%.
But, put these numbers together and we get something like a negative half point price deflator. That would be a record, the first negative deflator in 40 years, the first time since the Nixon Shock!
Do we care?
Normally no, we should be able to handle a half point price decline, except we had a 1 point rise last quarter, so the relative, the second differential on price, is very high. We do not meet the flow constraints, this is not adiabatic. This looks fubar. But does it mean Gray Bar? Dunno, if it is contained to one quarter then fine. But is looks very weird to me, very out of the ordinary.
Behind all this is the straight up, 18% rise in the trade weighted dollar. The world wants our prices to be reset to 1985 levels!
No comments:
Post a Comment