Monday, July 7, 2014

Simple thinking of economists in the olden era

Quoted by Nick Rowe:
Samuelson 1958. 'If the rate of interest on government bonds is forever less than the growth rate of the economy, the government can run a sustainable Ponzi finance of deficits, where it rolls over the debt plus interest forever and never needs to increase taxes, so there is no burden on future generations.'

We know that a government Ponzi sceme delivers increasingly accurate knowledge about the government's next debt transaction. Hence, actors will adjust their sequences of actions to redistribute that knowledge out into the economy. This is the maximum entropy process. At some time the variance in growth and the variance in government borrowings will equalize; entropy is maximized and the ponzi stops. 

Sunday, July 6, 2014

What I am reading about the theory of counting

Information Transfer Theory


Information transfer model of natural processes:
from the ideal gas law to the distance dependent redshift

Information theory provides shortcuts which allow to deal with complex systems. The basicidea one uses for this purpose is the maximum entropy principle developed by Jaynes. However, anextensions of this maximum entropy principle to systems far from thermal equilibrium or even to non-physical systems is problematic because it requires an adequate choice of constraints. In this paperwe apply the information theory in an even more abstract way and propose an information transfer model of natural processes which requires no choice of adequate constraints.

Here is the Jaynes. He lost the flat top in later years. Wiki summarizes:
He argued that the entropy of statistical mechanics and the information entropy of information theory are principally the same thing.
 And that is our hero for today.


This reading comes from Jason Smith who uses the model for the economy in price setting.

The basics is that minimal redundancy is a unique solution for aggregate systems, under generally relaxed assumptions. The main assumption is connectivity and locality. It may take a few steps but the process knows the path. That results in Hyperbolic differential wave solutions, I think though am to lazy to proof. So, I am happy man and not so nutty after all.

What did Jaynes miss?

Physical process may be modelled as finit sample rate information flows, and give equivalent results as a dual, quantized network, the thing that computes finite log. He gets this part. He misses that they physical process are not just duals, they are infact maximum entropy wave motion exactly as specified by information flow. It is it exactly. Hence the bound uncertainty about the sample rate of light, the Higgs field is really the position quant. And Occam's Razor tells us the simplest solution is the three bubble system under a curvature gradient. Slam dunked that baby.

Poisson distribution and not quite maximum entropy

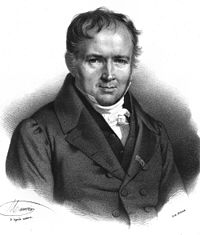
Here he is, Simeon Poisson, the queue master. He looks like a determined mathematician doesn't he?
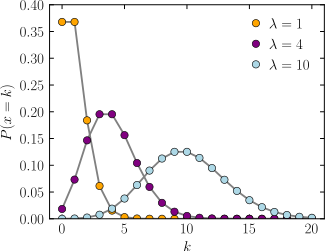
This is his probability distribution. It tells us how many drunkards are waiting for the bartender when they go bar hopping.  The drunkards arrive alone,  ungrouped wandering  the street, and meander into the next bar.  That is  called Gaussian arrival rates, and the bartender has a fixed service time, the time to fix one drink.  In a Shannon decoding network, the drunkards are organized into groups, some groups want a martini, some a screwdriver; thus bar tender can organize an assembly line, first setting up the glasses, then allocating the liquor, then the additive.  When the bar is so organized, then the wait in line is minimized, and the number of drinks along the assembly line is stabilized.

Here is the entropy for a poisson, or the amount of redundancy removed from the wait in line when customers are not groupd.  The greek character that looks like a chair is called Lambda, and is the average arrival rate. This equation, with a change of sign and moving the right part across the equal sign looks like out typical Shannon condition. Put the summation into the form of our sdigits in powers of the natural log and we have it.

What is time?
Simply the smallest, finite action that can be taken, measured relative to the error rate of the multiplier, it is the baud rate. How is that related to the entropy and size of the aggregate? What is the relationship between the finite log in math, the Stiglitz screening function in economics, and acquiring the vacuum expectation value in atomic physics? How do we relate entropic inefficiency and the lambda constant?

Mathematicians need to set this all up, queueing is basic to the whole natural process everywhere; from the atom to the web to economics.  Queue shifts are changes in the recursion forumula of discrete sets of integers.

The time is now for mathematical heroism, and companies need to pay high wages for mathematicians who understand minimal redundancy, finite measuring networks, the Theory of Counting.

Saturday, July 5, 2014

The Rahn currve, Treasury Curve and Plank's curve

The Rahn curve is a probability distribution, just like the Plank's curve. The X Axis is term, as in term structure as used in the Treasury curve, or wavelength in the Plank's curve. So, short term mean frequent activities in the economy. The Y axis is simply the probability that the actions available to the economy will result in activity at the term length on the X axis, at maximum entropy, (emphasis mine). The Treasury curve is simply the cumulative distribution of the Rahn curve, as near as I can tell. That is, bankers curves are always upward sloping.

The Rahn curve, the Yield curve and Planks curve include all activities in the economy, or in the atom, or in the system.  That is, it includes all the bounded band separators for all separable groups. So it would be my spectral curve of the proton after applying all the base bounds and creating the corresponding unit spheres through exponentiation. The Rahn curve is simply the radiation curve of the economy. It is mentioned with reference to government since government is has the least degrees of freedom in its band width, and thus government is the constricting bounds against which other unit spheres have to separate.

The Rahn is thus the fundamental distribution of the economy at maximum entropy. The peak is the temperatue of the economy at maximum efficiency. Altering the efficiency value, as we should, will distort the curve, so this is the maximum.  It is a recursive function, so it will be a hyperbolic differential, I think.

Inefficiency results because the (1/p)*Log(1/p) are not all within one, which is the maximum entropy condition.  The set p are prices, a finite set, I would think. The pricing is inefficient for a number of reasons, like distortion of fair voting and over bearing central banks result in sub-optimum currency zones.

Lars E.O. Svensson on Sweden: bank rates, unemployment and inflation.

Lars:
There is a lively ongoing debate about whether raising interest rates beyond the level needed to stabilise prices – ‘leaning against the wind’ – is a justified modification of flexible inflation targeting (as discussed in Smets 2013). In a new paper, I explain why leaning against the wind is the wrong monetary policy for Sweden (Svensson 2014).
Now this author seems to have it backwards, but he was careful to mention raising rates only once inn the full article. Tightening is not always the opposite of keeping bank rates low. The Swedish bank also issued other sets of rules that restricted excessive indebtedness. But still, we can see in May 2010, when the bank raised rates, inflation also rose. The opposite happened on the way down. The inflation rate seems a bit lower when the bank returned to low rates, is this out of trend? Not with Europe in general, maybe for Sweden, but I have no way to tell since the crash would have changed pricing considerably. But Lars has no way to tell either.

Then the author calculates the debt relief from inflation.
A lower than expected inflation rate contributes to increasing the real debt burden, that is, debt relative to the general price level

 From where to where does he calculate the gain or losses from inflation? If the homeowner took out a loan in Jan 2010, then looked at both rate rises and inflation rises, he gains. Taking out a loan when inflation and rates are the highest, the homeowner loses.

But, it seems to me, not having the data, the the bank is reacting after the fact in 2010, so most home owners stood to gain, over all.  They lose a bit of inflation at the end, but make up for it with a lower captured rate.

What about unemployment?

This is not seasonally adjusted.  But we can see a half point drop in unemployment, after the rate hike! Still, this seems backward from the authors conclusion.


Charts from Trading Economics. I could double check my sources, but I am not going to bother.  This is the fourth of fifth time the author has it backwards, and it is time the authors check there sources, and check their Y axis.

Romer and Romer pioneered the data removal and shifting exercise, claiming Milt Freidman pioneered the concept. I think its statistical fraud; does not matter that Uncle Milt did it. I read Uncle Milt's book a long time ago, and I do remember he would mention some normal central bank bungle, then skip ahead to bad data and attribute that to the bank.  So, it is no wonder that we have suffered through decades of blinded idiots at the helm of the Fed. The Fed is a huge monopoly, it mostly causes damage when economists tell it to enter the market with full force.  Most economists do not understand maximum entropy networks, so mathematicians should correct this, pronto.

A bit of a dip coming?

I have the Treasury rates, the interest rate per year on the treasury debt from  one year to ten years on this chart. I also have the debt to GDP ratio.

Here is what to notice, the spread. When the color lines are spread out then we are in a dip. That is, the risk from sell a two year note and buying a ten year note goes up.  When the lines are spread apart the risk is higher going from two to ten, for example.  The lender needs more rate if he is letting you hold cash for that long.  Look at that spread starting with the end of the crash, it is a large spread, then it gets narrow at about 2012, when the economy picked up a bit. Now it is spreading again, as if we are having a bit of a dip in output. Looking back at the middle of the cycles, when business was good, the spread was narrow.

What about debt to GDP?

The orange line above. It has turned sharply up, just as the spread increased. Well, that's a bummer, especially since we barely got the yearly deficit back to 4% of GDP when it was 10% of GDP.

So what next? Dunno. But the economists are in the stars,  they think the jobs report was exciting. Somone should look at the term structure of government debt, how much of that is long term and how much was short term.  last I looked it was mostly six year debt. It matters, when the debt structure is increasingly long term and has to be rolled over, then the debt costs get a double whammy spike.

As a temperature spectrum

Its a colder economy, longer wavelength radiation, the peak moving out to the long end. When the economy is over heated it is not maximum entropy, and has a flat spectrum. This is an economy that is trying to get efficient fast, trying to find a peak. That is our problem, we do not have efficiency when running at capacity. Mathematicians need to add the inefficiency into the yield curve model.  Wiki has an article on that under general entropy modelling, I think.

The absurdity of Central Bank targeting

I have in this graph the personal consumption expenses, the dollar deflator and the effective federal funds rate.
What is the effective federal funds rate?
It is the rate at which banks lend to each other overnight, computed here as a yearly interest rate. It is what the central bank targets, in the sens that the central bank will interfere in the overnight lending market ot make the rate what it wants.  The mandate the Fed has is to make that rate set so that consumer inflation and employment of stable over the entire country. However, it is simply clueless about the relationship between the overnight lending rate and uniform inflation, so its operations are a crap shoot.

Think a minute what that means.  We have a 20 trillion dollar economy, from the loggers of Oregon to the tourist traps in Florida to traders in New York city and house flippers in Los Angeles.  What is the likelihood that all these disparate economies will always have the same employment rate and inflation rate at the same time? Zip, none, never happen.

So what happens?

First, interbank lending dries up, it will never return. Then, over time all these separate economies crash together, or they all become dependents of government. The entire idea is stupid and was arranged by none other than Congress.

So central banking never works in a distributed economy?
I dunno, but targeting by central banks is fairly stupid.  If the central bank is in a distributed economy, like ours, it should defer to the neutral position as best it can. I always supposed it should simply aim to keep the yield curve fairly smooth at the short end, but I haven't though about it lately.  perhaps it should target the variance in unemployment and inflation, keeping the variance within range.

Friday, July 4, 2014

The economy does a Higgs bandwidth split

True or not? The net job situation in the released jobs report is 800,000 new part time jobs and  522,000 lost full time jobs. That is right, 522k full time jobs were destroyed.  What are the possibilities that weather caused that? Zero zip, has nothing to do with weather. 

Three things are happening to jobs. 
  • Thing one, the adjustment to the new wage settings for Obamacare, businesses want to maximize the gain from taxes and subsidies on wages. 
  • Two, manipulation of the Obamacare money by California, using it for nefarious purposes of recruiting new citizens for the secession. 
  • Three, the economy is preparing for our eight year presidential recession.

The transactions costs on maintaining 700k part time jobs is triple that necessary for the full timers.  Less gain from training, more government paperwork per hire, more time spend on searches.  That is, overall, a reduction in the band width of the economy. Our Log(1+ SNR), our measurement quant we need to hunt down and hire has been cut in half, job flow is cut in half, the economy has to reset wage groupings up the line.

 We did a Higgs:

This is an economy that has run up against the Higgs bandwidth. Hiring did a recursive split in the job queue, converted the surplus and existing queue to part time, thus gaining the extra degrees of freedom, making three degrees? Mathematicians, this is bandwidth grouping, we jumped the Markov tree? How did we do this? Was it a Log3(N^(1/3))? Did they do a shift in the recursion, to a cubic from a quadratic? Mathematicians go at it, solve this thing, get a Nobel.

Let's try and keep it a mild recession.

Mathematicians need to control economic theory

The same as you did in physics. What was the secret? Light has a high center frequency with finite narrow side bands.

It makes all the difference in the world, and it needs to be done in economics.  These bozo macro economics theories with their 'everything at once' are systematically destroying the economy. Mathematicians arise, bring us your groups, band stops, locality, Lagrange bounds, maximum entropy, minimum phase theory and the rest of your finite bandwidth theory. And recursive sequences, important as economics is a nearby phenomena. Save the economies of the world, please.

Thursday, July 3, 2014

Mathematically ridiculous; the economic DSGE model

Economists, some of them, use something called a Dynamic Stochastic Equilibrium model to predict the activity of multitudes of households and firms.  That model relies on something called Bayesian conditional inference. Thus, a household may decide to buy a car if house prices are stable in the neighborhood.  A business might expand its operation if the town is growing by 5%. The idea is that each choice is conditional upon some event in the economy.  The model is correct if the number of events possible in the economy, arranged in their possible sequences, form a Bell shaped curve.  But you need enough of a set of disorderly events in your economy to make this curve smooth, otherwise you calculations are for shit and worthless.  The curve must be smooth. How many sequences of vents to we have?
Bell Shaped Curve
That means, some sequence of events will probably happen as indicated by its coordinate on theX axis, at the left. The probability of that action being the coordinate on the Y axis.

Unemployment Rate
Take a look at the unemployment rate for the last 60 years. Ask yourself how many motions are there in that curve? Well, starting with 1980, I see basically one major motion, up and down about every eight years. Then I see a mid course correction every so often that lasts a year. That mid course correction contains about three jiggles, more or less.  So in total, this unemployment rate demonstrates the households and firms engaging in about 5 or 6 choices that are conditions upon the economy at large.  Every other motion they engage in is basically business as usual, about 90% of the time.

Those few degrees of freedom is not a Bell curve, folks, those DSGE equations are not going to work.  This is an economy dominated by four large agents, jerking everyone else around.

Better Models:

The correct model seems to be Public Choice, though I cannot be sure.  Young economists should look carefully at what I am saying, then go look at what other models do, Public Choice, and queuing models, mainly. This model is definitely the third choice. I suspect the best model whould be a queuing model with two or three lines of firms or households getting goodies from a few agents.

Can Stochastic Equilibrium be fixed?

Sure, make a stochastic version of the Hyperbolic differential equation. Get some help from the mathematicians, and the physicists will share the cost. Where the physicists have quarks, the economists will have the California, Texas and Florida economies.  Where the physicists have electrons, the economists will have medium sized firms across the USA. You are going to estimate the differential coefficients for these large movers. Once you get a few principals components modelled, then recursively gang them up into complex graphs.