
The economy will actually do the calculations for us with the dollar deflater:
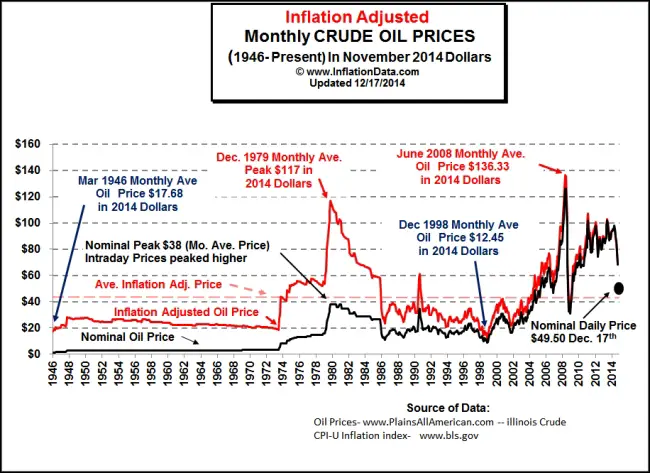
The oil prices chart works because it displays the correlation between dollar deflater and oil trade. The variation in the international value of the dollar is mostly determined by American oil imports, has been since 2001. That is a sign of oil shortages, though economists often imagine some money illusion that causes the problem.
No comments:
Post a Comment