Ian Murray tries to track it down, and Kling references his numbers.
Remember these limits. As near as I can tell, Ian is counting only central government workers. There exists additional local and state government workers, and also one must count the total people on government paycheck, meaning social security and government retirees.
The total is likely closer to 50% of the population. But this is a bit unfair. We really need a metric that tells us how many government employees that are well matched to electorial power of the citizens. A state employee in Kentucky is much more responsive to voters than a state employee in California. So we need an adjustment to account for Hanson's near and far effect.
The whole problem is unmeasurability, we have no way to count things as long as voters are mal proportioned. I would take Ian's numbers and multiply by 2, getting 34% of the population obtains paychecks from voters with little direct voter participation. That number is less than the 50% the total government consumption of GDP.
Thursday, February 3, 2011

Instapundit falls for Senator worship
He interviews a Senator Corker with 8 congressional districts from a state on federal welfare with a $1.25 returned gain on every dollar of federal taxes.
Glenn Reynolds is a bit delusional, bordering on disingenuous. Senator Corker is going to say whatever it takes to keep his fake elite status and his Tennessee welfare money.
Glenn Reynolds is a bit delusional, bordering on disingenuous. Senator Corker is going to say whatever it takes to keep his fake elite status and his Tennessee welfare money.
The new David Glassner paper

His claim is that the crash was all about sudden deflationary concerns starting in mid 2008. The evidence is the sudden correlation between the S&P with inflation expectations. Sumner and Yglesias jump on this as advocacy for NGDP growth.
We sure did have a demand collapse with oil at $140 near the peak, and that certainly got the attention of traders. What does that tell us about the Sumner theory on NGDP growth? We can grow NGDP when oil is no longer a constraint.
Looking further in the paper:
The response of nominal and real interest rates to expected deflation becomes problematic when nominal interest rates fall toward zero while the expected rate of deflation is increasing. As nominal interest rates approach their lower bound, further increases in expected deflation cannot cause the nominal rate to fall.No, it is not problematic at all. A rank reduction occurs in the economy and the S&P traders recognize the new normal and their trading pattern adapts to a new, simpler economy. What is crazy is that after 80 years since Fischer economists still think the economy counts large changes in smooth proportions and Fischer, 250 years after the invention of industrial specialization, couldn't figure it out.
Scott sumner wants us to determine why traders change correlations like this. Economists have aslo been asking themselves what to do about heteroskedacity since they started doing regressions, and that question is equivalent to Scott's, and also at the heart of the Zero Bound canard.
Economies of scale dictate that we cannot make large changes smoothly. Traders change their regression variable, en mass, because they are subject to economies of scale.
And that brings us to Mark Perry who celebrates productivity growth. Yes, if we hold the current, post crash production chain then we can become top heavy exporters and rebalance the current accounts. Mark misses one point, we still have very substantial changes in the economy required to sustain an export mentality, and those changes involve something close to a revolution in political thinking, namely massive cuts in the government burden or much greater government efficiency. The consumer demand does not pick up until we make these changes.
Which brings us to Ben and the Fed. Why does it take a massive infusion of printed money to force restructuring? Because government is not cooperating with the new effort to rebalance to an export economy. Government will not cooperate as long as Ben is willing to fund their debt. Ben should change is tune and demand that the debt limit become a political football for it is the only tool Ben has in making Congress cooperate with his goals.
And that brings us back to growth statistics. About 40% of the new growth since the bottom has come from changes in government spending. This could be coming from a good rebalancing of the total government channel with total government spending smaller overall. But more likely, this is growth in government spending with an impending GDP revision downward, likely to happen in a few quarters when economists get enough time to average out the heteroskedacity issue.
Rand Paul fights the Big Govenment Conservatives
He is ready to cut everything, everywhere. I say good luck and keep reading my blog.
Whoops on oil imports

Four week average, oil imports
Oil is badly quantized againOil price has been holding steady in the $90 range. and we get a sort dip into the $85 range, and oil imports jump. Global oil allocations are still not smooth.
Volatile supply or demand?
Chinese bureaucrats got nervous, then winter got colder. That's the demand side. On the supply side, OPEC tried to keep things stable,then Egypt erupted. Who cares, the problem is oil remains constrained, and both supply and demand instability have too large an impact on oil flows.
How can we fix this?
Look at how late the DOE is in reporting imports, a month late. That is the economic observation error. Look at how rapidly Arabs revolt, China changes policy and fast winters happen. Match event volatility to observation error, and conserve short term reserves to cover surprises.
Wednesday, February 2, 2011
Egad on the human rights thingy
That October 2009 decision ordered Telfer to pay $36,000 to a woman who had been her employee for six weeks. Lawyers wanted the sheriff to seize and sell Telfer’s home to collect the money.
The woman who lodged the complaint, Seema Saadi, told the tribunal she felt pressured to wear skirts and heels instead of her hijab. Saadi also said Telfer complained about the smell of food that she warmed in the microwave. (…)
I gotta be in trouble considering my view that the Sunni Islamic crowd should to lift their shirt so we know if they have a belt bomb. I mean, how else do we tell if a Sunni is going to explode suddenly? If Seema Saadi wore skirts it would be a lot easier to notice a belt bomb and run for cover,
My plain and simple model
Very quickly, my layman's model is precision: How accurate can the economy deliver a retail good that fits a consumer's unique need at the moment the consumer needs it. It is the precision of the economy that matters. Krugman wants simple metaphors and I have always used this one.
Advancing the theory a bit
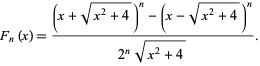
Stolen chart from Mathworld
Computing the Fibonacci numbers, when bandwidth are varies around the value x=1
Let me take for granted the Fibonacci series is what we want for determining the equilibrium transaction rates along any yield curve constructed of minimal redundancy production networks. The equation above are the Fibonacci polynomials which compute to the Fibonacci series when x = 1. Hence, the Nth Fibonacci number is Fn(1.0). Transaction rates along the curve would be given by: F3(1.0), F4(1.0),...
Bankers do not use the formula above, instead they use this one: Fn(b) = x*Fn-1(b) + Fn-2(b). This means that the rates at one term are really determined by the rates at the two longer terms above. The banker can work the problem from the short end or the long, it depends on where the constraints are. And, we should be dealing with transaction rates, not term periods.
The advantage in our case is, though I say that without proof at the moment, we can treat x as the basic bandwidth of the system. So then when production slows when x, the bandwidth, slows. We can recompute the nearest optimum set of transaction rates, while off equilibrium, by setting x off unity by a bit. This is great news, and I am playing with off equilibrium yield curves, like the one we had in Fed 2006, and I think this method will track the performance we saw.
Here are some yield curves at different bandwidth. Remember that these curves are relative to current equilibrium, when bandwidth = 1.0. Scales are constant but not calibrates to the real economy.

Economic bandwidth is below equilibrium

The economic bandwidth at equilibrium

The economic bandwidth above equilibrium.
The key variable is bandwidth relative to equilibrium. Currently we are pushing bandwidth above its equilibrium point, QE2, but the economy has already dropped rank
Warning! I often gets things off a little when working right onto the web, but this is my current best.
Here come the union scare tactics
"The notion of another $2 billion in cuts is frightening to us and should be to everyone who cares about education," said Bob Wells of the Association of California School Administrators.Translation, we control government and we want our pensions. I prefer a California default.
Subscribe to:
Posts (Atom)