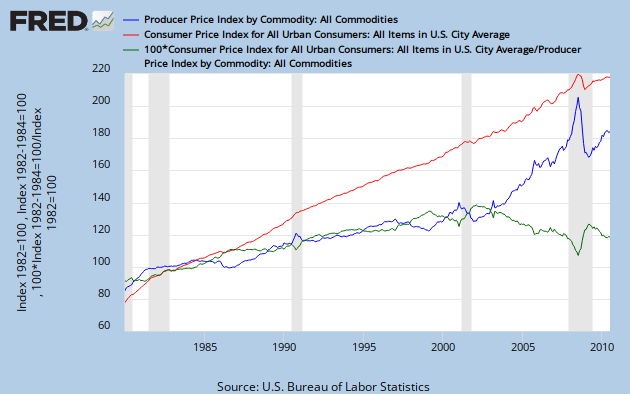
Consumer, producer, indices; and their ratio
Notice the great job keeping CPI stable while PPI makes all the adjustments. Since 2003 producers have been struggling, consolidating and holding inventories longer, hoarding goods and cash to manage PPI variance. After the glitch, a similar problem.
Of course my UEC shows a very steep bloated curve in 2003, just like today. What do we call a producer deflation, the green line that trends down from 2003.
The ratio is a variance ratio, the variance of consumer inventories to producer inventories. Under stress, the producer wants to extend its space on the production spectrum, to increase integration times on the inventory cycle, hence reducing variance. That slowing down is a deflation, a shift left on the production spectrum.
The period at the end of 2005, when producer prices leveled off, during that period the Fed was in shift mode, going from too flat to too steep. For that brief moment, the Fed was on target.
We can't keep the curve steep that long, very soon we will get a producer deflation that may disconnect the link to millions of consumers.
Why not watch the Green Line, keep it moving level. Raise rates when it drops, lower them when it rises. By doing that the Banker is keeping the curve at maximum entropy, with respect to the producer-consumer link.
No comments:
Post a Comment