Tuesday, February 11, 2014

Adam Kinzinger, R-Ill is an idiot

Roll Call: “Maybe Ted Cruz should spend a little time trying to win the Senate instead of attacking his fellow Republicans”Rep. Adam Kinzinger, R-Ill., said Cruz should play a more constructive role rather than taking on other Republicans. “In terms of the debt limit, we have to be realistic that we don’t want to default on our debt,” Kinzinger said. “We also don’t have the Senate. “Maybe Ted Cruz should spend a little time trying to win the Senate instead of attacking his fellow Republicans,” he said. “I thought that Ted Cruz was past [that], but maybe he isn’t.”

I have to introduce Adam to the concept of long division, he evidently never passed third grade. OK, here goes:

Texas is about six senators short compared to the average ratio of Senate seats to congressional districts.  It does not matter whether the Senate is Republican or Democrat, the amount of Senate democracy available to Texans is still the same, about six short. Texas Republicans and California Democrats are in agreement, they want less federal volatility, and implicitly push for less federal government and more state government.

Matt Kahn is more right than even he realizes

Talking about adaptation to environmental factors:

General Equilibrium Effects Caused by California's Drought?
A quote: "Fresnans have long resisted water-saving measures, clinging tenaciously to a flat (pricing) rate, all-you-can-use system. Nudged by state and federal officials, Fresno began outfitting new homes with water meters in the early 1990s, but voters passed a ballot initiative prohibiting the city from actually reading them. It took two decades for all area homes to acquire meters and for the city to start monitoring the units. To its credit, Fresno has a watering schedule, limiting when residents can water their lawns. But enforcement, to put it charitably, is lax."

I am from Fresno, and Matt missed an important effect about the water meters. They use wireless technology and the water department can read water usage with accuracy. So they notice our leaks, and inform us about the problem on a household basis. Hence, we have all, including me, been on a hunt for the water leaks, and fixing them very fast.

Also, I might add, the completion of water meter installation was rushed forward by the stimulus, one of the few places where we had a multiplier greater than one.

Ezra Klein wants Krugman to improve his theory of information

Ezra makes an important comment:
I don't quite understand the model of politics underlying the backlash-to-the-backlash over the CBO report. The theory is that though the GOP's initial spin on the report was wrong it's meta-right because the lies will be used to power effective attack ads in the fall -- and in politics, what's true, and what voters can be tricked into believing is true, are two equally valid categories for inquiry. You see this model of politics all the time -- particularly during elections, when the press gives wall-to-wall coverage of gaffes not because anyone believes the gaffe was important, but because they believe it might end up in attack ads. Beneath that model of politics lies an assumption that an important scarcity in politics is "lines that can be used in attack ads," and so every time one party or the other finds one of those lines, it's a big deal. This seems to me to wildly underestimate the creativity of the people who make attack ads.

Why is there a multiplicity of things politicians might say but a deficit in the methods to say them? Sounds like a supply dysfunction in the ability to deliver political information. Keep at it Ezra, you are getting damn close to the secstag problem. Ezra is, in fact, one of the few bloggers looking in the right place. Ezra would profit from looking at this research. Ezra would also profit by learning about a well established theory of information flow.

Yellen to keep the curve steep

Yahoo: NEW YORK, Feb 11 (Reuters) - U.S. stocks rose on Tuesday after new Federal Reserve Chair Janet Yellen reinforced the central bank's plan to trim its market-friendly stimulus, while also noting labor market conditions needed to improve.
In her first public comments as Fed chief, Yellen emphasized continuity in the Fed's policy strategy, saying she strongly supports the approach of her predecessor, Ben Bernanke.
"They are apparently loving what Janet Yellen has to say which is really, 'hold the course steady, here is what I am.' She is not any different than what they expected her to be," said Ken Polcari, Director of the NYSE floor division at O'Neil Securities in New York.

Stocks are now needed for short term liquidity and more stocks moved to short term reserves from longer term reserves. More deflation and more deficit reduction on the way. Lets budget the finite accuracy in this case. The government channel has a natural inaccuracy greater than the private sector. Because the government channel owns the fiat banker, the inaccuracy of government increases a bit. Yellen by being inaccurate is doing her job, exposing the slight additional inaccuracy of the hegemon fiat banker.

Monday, February 10, 2014

California, less of a doner state?

Says Wiki, as of 2011


In 2005 California was contributing 25%, less now. Florida now is most at risk from federal budget cuts, a net receiver by 50%. The reason is likely because of less federal flow, and more California taxes. So California taxes stay in state. Texas is a net receiver, by a little.  But Florida is the fourth largest by economy, I think. New York, a net doner. Minnesota, as usual, is the most generous state.

 Texas and California disconnecting, Florida more connected. As the federal budget moves toward balance, each states needs more reserves to stand on its own. Florida mainly is a recepient of social security. We are a nation held together by entitlement spending.

Here is the list:
Rank State Dollars (millions) Ratio to GSP[4]
Revenue[5] Spending[6] Net Revenue Spending Net
1 Minnesota 78,685 27,594 51,091 26.7% 9.4% 17.3%
2 Delaware 21,835 10,915 10,921 33.1% 16.5% 16.6%
3 Nebraska 19,795 11,304 8,491 19.9% 11.4% 8.5%
4 Illinois 124,431 69,535 54,897 17.9% 10.0% 7.9%
5 Ohio 111,094 70,881 40,213 21.8% 13.9% 7.9%
6 Indiana 51,239 34,060 17,179 17.2% 11.4% 5.8%
7 Massachusetts 79,827 57,839 21,988 19.8% 14.3% 5.4%
8 Arkansas 25,300 19,639 5,661 23.1% 17.9% 5.2%
9 Wisconsin 41,498 28,406 13,092 15.9% 10.9% 5.0%
10 Kansas 21,905 15,542 6,362 15.8% 11.2% 4.6%
11 New York 201,168 151,719 49,449 16.7% 12.6% 4.1%
12 Connecticut 47,263 39,266 7,997 20.6% 17.1% 3.5%
13 New Jersey 111,377 94,236 17,142 21.9% 18.6% 3.4%
14 Colorado 41,253 33,515 7,738 15.1% 12.2% 2.8%
15 Pennsylvania 108,962 95,340 13,622 18.1% 15.9% 2.3%
16 Rhode Island 10,992 9,998 994 21.6% 19.6% 2.0%
17 Oklahoma 27,087 23,987 3,100 16.8% 14.9% 1.9%
18 Utah 15,642 13,143 2,499 12.0% 10.1% 1.9%
19 California 292,564 258,919 33,645 14.6% 12.9% 1.7%
20 Wyoming 3,828 3,474 354 10.0% 9.0% 0.9%
21 Missouri 48,413 48,059 354 18.7% 18.6% 0.1%
22 Washington 52,444 53,058 -614 14.0% 14.1% -0.2%
23 Michigan 59,210 60,483 -1,273 14.8% 15.1% -0.3%
24 Tennessee 47,010 47,924 -914 17.0% 17.3% -0.3%
25 Georgia 65,498 68,297 -2,799 15.1% 15.8% -0.6%
26 New Hampshire 8,808 9,403 -595 13.6% 14.5% -0.9%
27 Iowa 18,754 20,511 -1,758 12.3% 13.5% -1.2%
28 Nevada 13,727 15,794 -2,067 10.3% 11.8% -1.5%
29 South Dakota 5,136 5,951 -815 12.1% 14.0% -1.9%
30 Oregon 22,717 26,835 -4,118 11.4% 13.5% -2.1%

District of Columbia 20,748 23,701 -2,954 18.9% 21.6% -2.7%
31 Alaska 4,899 6,954 -2,055 9.4% 13.4% -4.0%
32 Texas 219,460 277,457 -57,997 15.7% 19.9% -4.2%
33 North Carolina 61,600 81,971 -20,371 13.5% 18.0% -4.5%
34 Idaho 7,622 10,397 -2,775 13.1% 17.9% -4.8%
35 Maryland 48,107 63,638 -15,531 15.1% 20.0% -4.9%
36 Kentucky 25,086 33,586 -8,500 14.5% 19.4% -4.9%
37 North Dakota 5,665 7,993 -2,328 12.3% 17.4% -5.1%
38 Vermont 3,525 4,958 -1,433 12.9% 18.2% -5.2%
39 Montana 4,384 6,730 -2,346 10.8% 16.6% -5.8%
40 Arizona 34,850 50,992 -16,142 13.1% 19.1% -6.0%
41 Maine 6,229 11,044 -4,815 11.6% 20.6% -9.0%
42 Virginia 64,297 112,114 -47,816 14.4% 25.1% -10.7%
43 West Virginia 6,499 14,443 -7,945 9.4% 20.8% -11.5%
44 Alabama 20,883 45,489 -24,606 11.4% 24.8% -13.4%
45 New Mexico 7,866 21,585 -13,719 9.8% 26.8% -17.0%
46 Hawaii 6,512 20,169 -13,658 9.0% 27.8% -18.9%
47 Mississippi 10,459 32,113 -21,655 10.3% 31.6% -21.3%
48 South Carolina 18,557 74,098 -55,541 10.5% 42.0% -31.5%
49 Louisiana 34,811 116,008 -81,197 14.3% 47.7% -33.4%
50 Florida 122,250 528,376 -406,126 15.7% 68.0% -52.3%

TOTAL 2,511,771 2,969,443 -457,672 16.1% 19.1% -2.9%


Effective interest rates falling since 1980

The chart shows the effective interest rates paid by Congress, and falling. Why? Memories are long and the high rates of the Reagan era scare politicians? Maybe. One thing we know is that disinflation has been pushed by the Fed ever since Volker. Mainly, I think, Congress knows that interest expense is volatile and they are very frightened. Something is driving DC and the Fed to keep this interest expense down, this requires some thought.
So lets look at the ten year rate:
And we see the ten year rates dropping. The Fed has been deflating. Lowering the rates along the curve lowers the price of real assets along the curve.  In a stock and flow model, when the return from reserves drops the prices of real goods tends to drop. But this cannot hold, so there must be some other form of reserve substitution or real price declines.

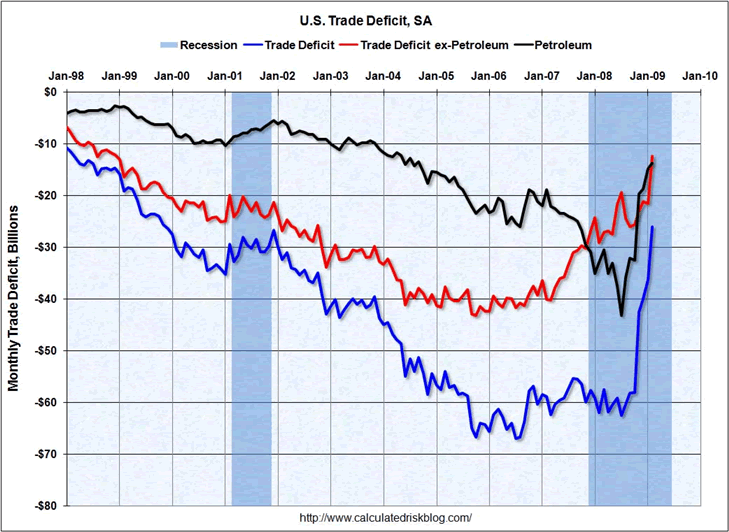
Imports bring lower prices and compensate for lower rates. And, at lower bound we have exhausted that resource. What comes next? Well oil prices now stabilize world inflation. As the world demands more oil we accept greater inflation.
Hence we expect global rebalancing. How is it going?


Deo’s bullet points:
FT Alphaville: Over the past five years there has been a clear inverse relationship between changes in domestic demand and changes in the external balance. With the advent of smaller US external deficits, the rise in foreign official holdings of Treasuries (from $600bn in 2000 to $4,000bn in 2013) has slowed and may even be reversing (with a decline of roughly $125bnbetween March and August 2013). The trade intensity of the global recovery has fallen. Prior to the crisis, a 1 percentage point increase in global GDP growth boosted world trade by roughly 2 percentage points. In the past five years, the trade multiplier has collapsed. Trade is growing in line with sluggish world GDP growth. With domestic demand still skewed towards the US, the UBS paper concludes conclude that: The US is still the sole major economic region capable of driving up its rate of growth via increased domestic demand. If the US is to restore full employment, it will have to do so without much help from the rest of the world. Given that the US economy does not have the same vitality that it did before the crisis, the exported recoveries elsewhere will remain correspondingly weaker for longer.

Obamacare Whoops

White House delays health insurance mandate for medium-sized employers until 2016
  Wa Post: The Obama administration announced Monday it would give medium-sized employers an extra year, until 2016, before they must offer health Firms with at least 100 employees will have to start offering this coverage in 2015.

My favorite indicator

That is consumer prices over producer prices. When we see that jump up fast then we have producers dropping from the market. The graph shows a mild correction, down. The correction has likely happened and correlates with the stock market's 10% correction and some cuts in government. No concern about a recession but a mild reduction in growth.

Sunday, February 9, 2014

Unemployment, CPI and wages in the great depression

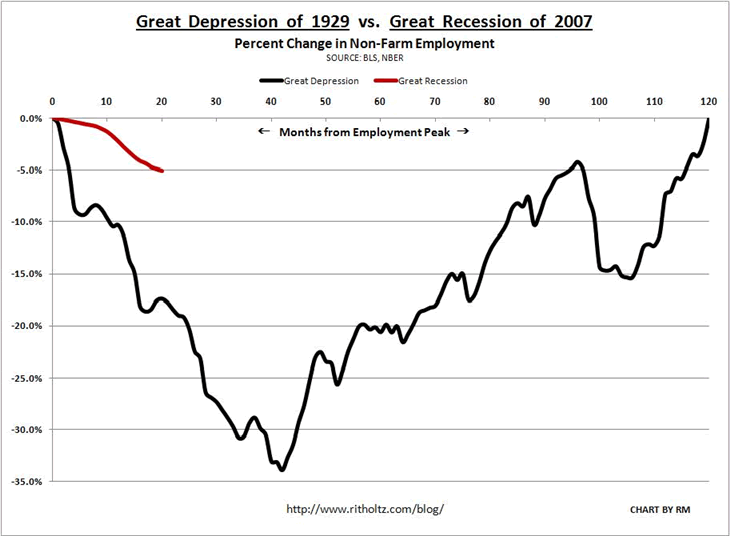
They match, seemingly in equilibrium on the way down. Why? Not sure.  But it is a current debate. This happens when everyone is aware of the problem, its a smooth transition down. The other possibility is a severe banking disorder that cannot be corrected by prices.  The banker would be holding rates to low, causing disinflation too fast and labor markets cannot reprice. But I doubt it. The GD was a real and known coordination problem, everyone was watching it.


Did the banker do it? CPI kept falling and the banker did drop rates a bit. This graph is a bit ambiguous, but it does show a continuing downward drop in rates durin the deflation and unemployment. If so, then labor employment would
never have time to stabilize. But I need a better picture.
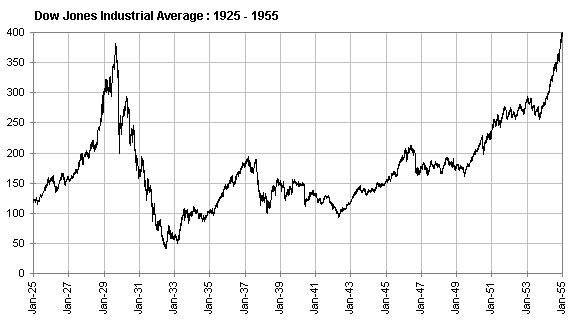
 But, if this was Fed induced deflation, then why didn't the market rise in response?

Oil is liquid, sort of like money

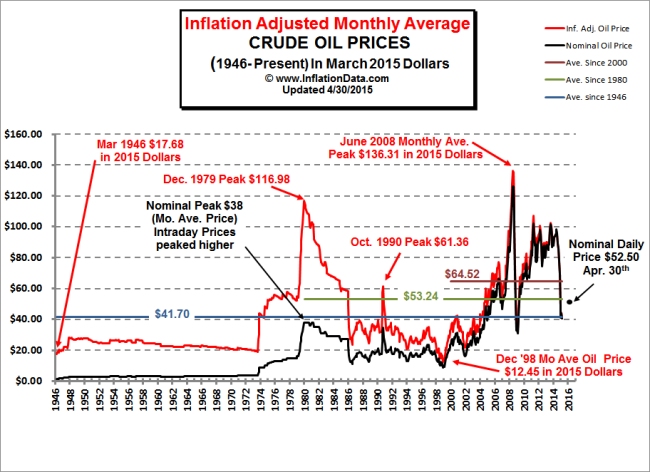
The real price of oil was killing us in the 80s. Volker raised rates above inflation, general prices rose and oil prices dropped. Since then oil has done an increasingly good job of stabilizing prices. The stock and flow of real goods is balanced, raising rates above inflation causes prices to rise so returns on liquid reserves match inventory volatility. Oil is more liquid than other goods so oil can change flow to adjust for returns. So Volker raises inflation, oil flows increase while other goods prices increase. Eventually the real and nominal prices of oil stabilize.