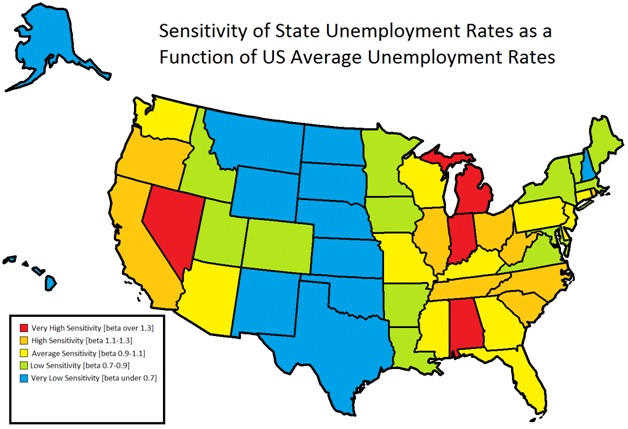
 From Aleph Blog All states are highly correlated to the national rate. Texas has oil and suffered the a savings and loan disaster on the 80s, hence shows independence from the trend.
California is the largest economy. California has a relatively high relationship to the average partly because it is a greater part of the average. California deviated mostly from the average during the boom years of the 90s.
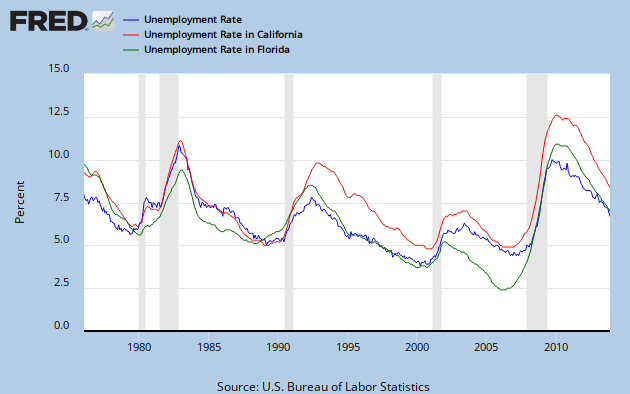
California led the nation in unemployment since the boom years, except for the crash of 2009. The connection between California and the average are the normal. California suffers oil shocks like everyone but Texas, and shares general trade. California has one other connection, DC and California account for some 30% of GDP in government spending. Just two governments. The boom of the 90s was fueled in part from a net transfer of taxes from California to DC. And then tax reduction from DC during the Bush years benefited California. Notice the alignment between California and the average in the Reagan years? Likely tax cuts again.
So how did we engineer the boom of the 90s while California suffered 2 point difference in unemployment in 1993? California accepted a higher gini coefficient. The large jump in Gini at the beginning of Clinton's term came from tax hikes which hit California and then defense cuts.
In the crash of 2009 what happened to California? Much of the housing crash happened there, and besides Florida, much of the housing boom happened in California, The deviations of California mostly match Florida, another housing boom an bust state. Together these two states have a 60% correlation, but they make up some 22% of GDP, and are the first and third largest state by population, and they are both sun belt states.
The 2009 crash was an oil crash. Unemployment, rising, was uniform everywhere except Texas, the oil producer. Then the delevering and mortgage default happened.
But, here is the point. California and Florida are out of phase and feed the cycle. Florida employment maximized just before the crash to 3% then unemployemtn maximized to 11% after the crash, a huge swing for a state that is 7% of the economy. California is monolithic and now coupled to Florida. California can generate taxes for a while then cannot. So California responds politically, behind the scenes, and the countercyclical force is multiplied. They cause the Fed to wait longer before normalizing. Housing policy in DC will be counter cyclical, so is tax policy, and any government program going through state capitals. It is reinforcing as voters in these states become increasingly confused about federal policy.
California was four years behind in the boom while Florida was two years ahead. Now California is two years behind. Together that variations is about 1.5% of GDP. Hence, we have identified most of the business cycle causes.
No comments:
Post a Comment