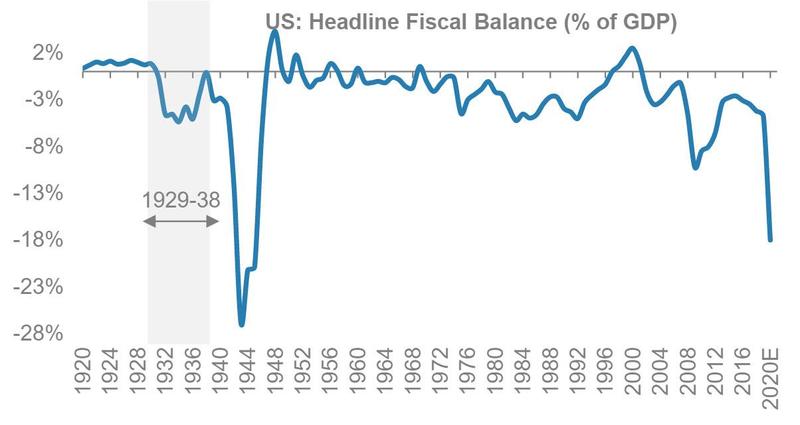
Look sat the tops and bottoms of that path 2000. They define a linear path, down. We have been in spiral, and this doubling of the deficit, twice, is a falling patterns, as in head first.
Chart is a prediction from
here.
We have an MMT moment arriving about now, in any event.
No comments:
Post a Comment